Choosing a mario kart world character and vehicle combination with some stats.
With 50 playable characters and 40 vehicles we have a total of 2000 possible combinations in Mario Kart World, it is a bit daunting to select a good combination from the lot. This post tries to make the exploration a bit more attainable and directed.
Intro
It is no secret that I am a huge Mario Kart fan so I got the game upon release with my Switch 2 and started playing a bit with my preferred MK8W speedrunning combo Rosalina + BiddyBuggy and more often experimenting with Rosalina + Baby Blooper, but playing through the Grand Prix and Knockout Tours I found some particular ones slightly harder than others and couldn’t quite put my hand on why (specially the ones with rougher terrain and water tracks). After giving it some time and thanks to the work of people in the community (see the data sources section) I decided to have a look at the mystery to figure out a balanced combination that matched well my playstyle whilst getting to grips with the new mechanics.
Code Dev
Dataset
As I mentioned in the intro, I didn’t obtain the stats myself so please have a look at the original sources and support the community if you can! I decided to use this table as source as it was relatively easy to transcribe into a more usable couple or CSV files. There was no real magic into this, other than copying everything over, and making it a dense, consistent set. A snippet of the characters CSV looks like this:
Character,SpSolid,SpCoarse,SpLiquid,Accel,MiniT,WeightCoin,HdSolid,HdCoarse,HdLiquid
Baby Peach,0,0,0,7,4,0,6,6,6
Para Biddybud,0,0,0,7,4,0,6,6,6
...
Rosalina,4,4,5,2,0,5,1,1,3
Bowser,6,6,6,0,0,7,0,0,0
Whereas a segment of the vehicles CSV ones follows:
Character,SpSolid,SpCoarse,SpLiquid,Accel,MiniT,WeightCoin,HdSolid,HdCoarse,HdLiquid
Baby Blooper,7,2,2,-6,-6,1,9,5,5
Biddybuggy,1,6,1,7,7,1,5,9,5
...
Standard Kart,5,5,5,5,5,2,5,5,5
Plushbuggy,5,5,5,5,5,2,5,5,5
With these two files we are all set to keep moving along in our analysis!
Clustering
The initial thought was to do some stat-based clustering to identify combinations that are similar to the one I was using (Rosalina - Baby Blooper). The first step, was to read both CSV files and list of all character - kart combinations, which can be done with:
(dfChr, dfKrt) = [
    pd.read_csv(path.join(PT_DTA, fn)).set_index('Character')
    for fn in ('CharacterStats.csv', 'KartStats.csv')
]
(CHARS, KARTS) = (list(dfChr.index), list(dfKrt.index))
COMBOS = list(product(CHARS, KARTS))
dfCmb = pd.DataFrame({
    f'{c} - {k}':  dfChr.loc[c]+dfKrt.loc[k]
    for (c, k) in COMBOS
}).T
Where we get the sum of stats for the kart and character in each one of the available options. With this in place, we can pick whichever clustering algorithm we prefer. In this case, I chose scikit-learn’s AgglomerativeClustering but it could very well be KMeans, DBSCAN, or any other. With this, we now select 200 as the number of different clusters to identify, so that we get a ten-fold reduction in the number of options.
cFun = AgglomerativeClustering(n_clusters=200)
cluster_labels = cFun.fit_predict(dfCmb)
clList= list(zip(dfCmb.index, cluster_labels))
values = set(map(lambda x:x[1], clList))
clustersList = [[y[0] for y in clList if y[1]==x] for x in values]
dfCls = pd.DataFrame(clList, columns=['index', 'Cluster'])
dfCls = dfCls.set_index('index')
dfCmb = dfCmb.join(dfCls)
We now serialize our structures and export the dataframe to disk for some later use:
pkl.dump(clustersList, open(path.join(PT_CLS, 'lst_clusters.pkl'), 'wb'))
pkl.dump(clList, open(path.join(PT_CLS, 'lst_clustersID.pkl'), 'wb'))
dfCmb.to_csv(path.join(PT_DTA, 'CombosClustered.csv'))
Radar Plot (Dash UI)
With the clustering done, I wanted to try out creating a simple application to compare builds one against the other. To do this, I coded up a Dash front-end with a plotly radar plot with each build stats. After the initial draft was coded, I decided to add a table with builds that are similar to the “base” selected (combo A). As we already had our clustered dataset, that was relatively easy as it we just need to filter the dataframe for matches with the same ID cluster. The resulting UI looks as follows (click the image for a live version, which might take some time to load as I am using the free tier):
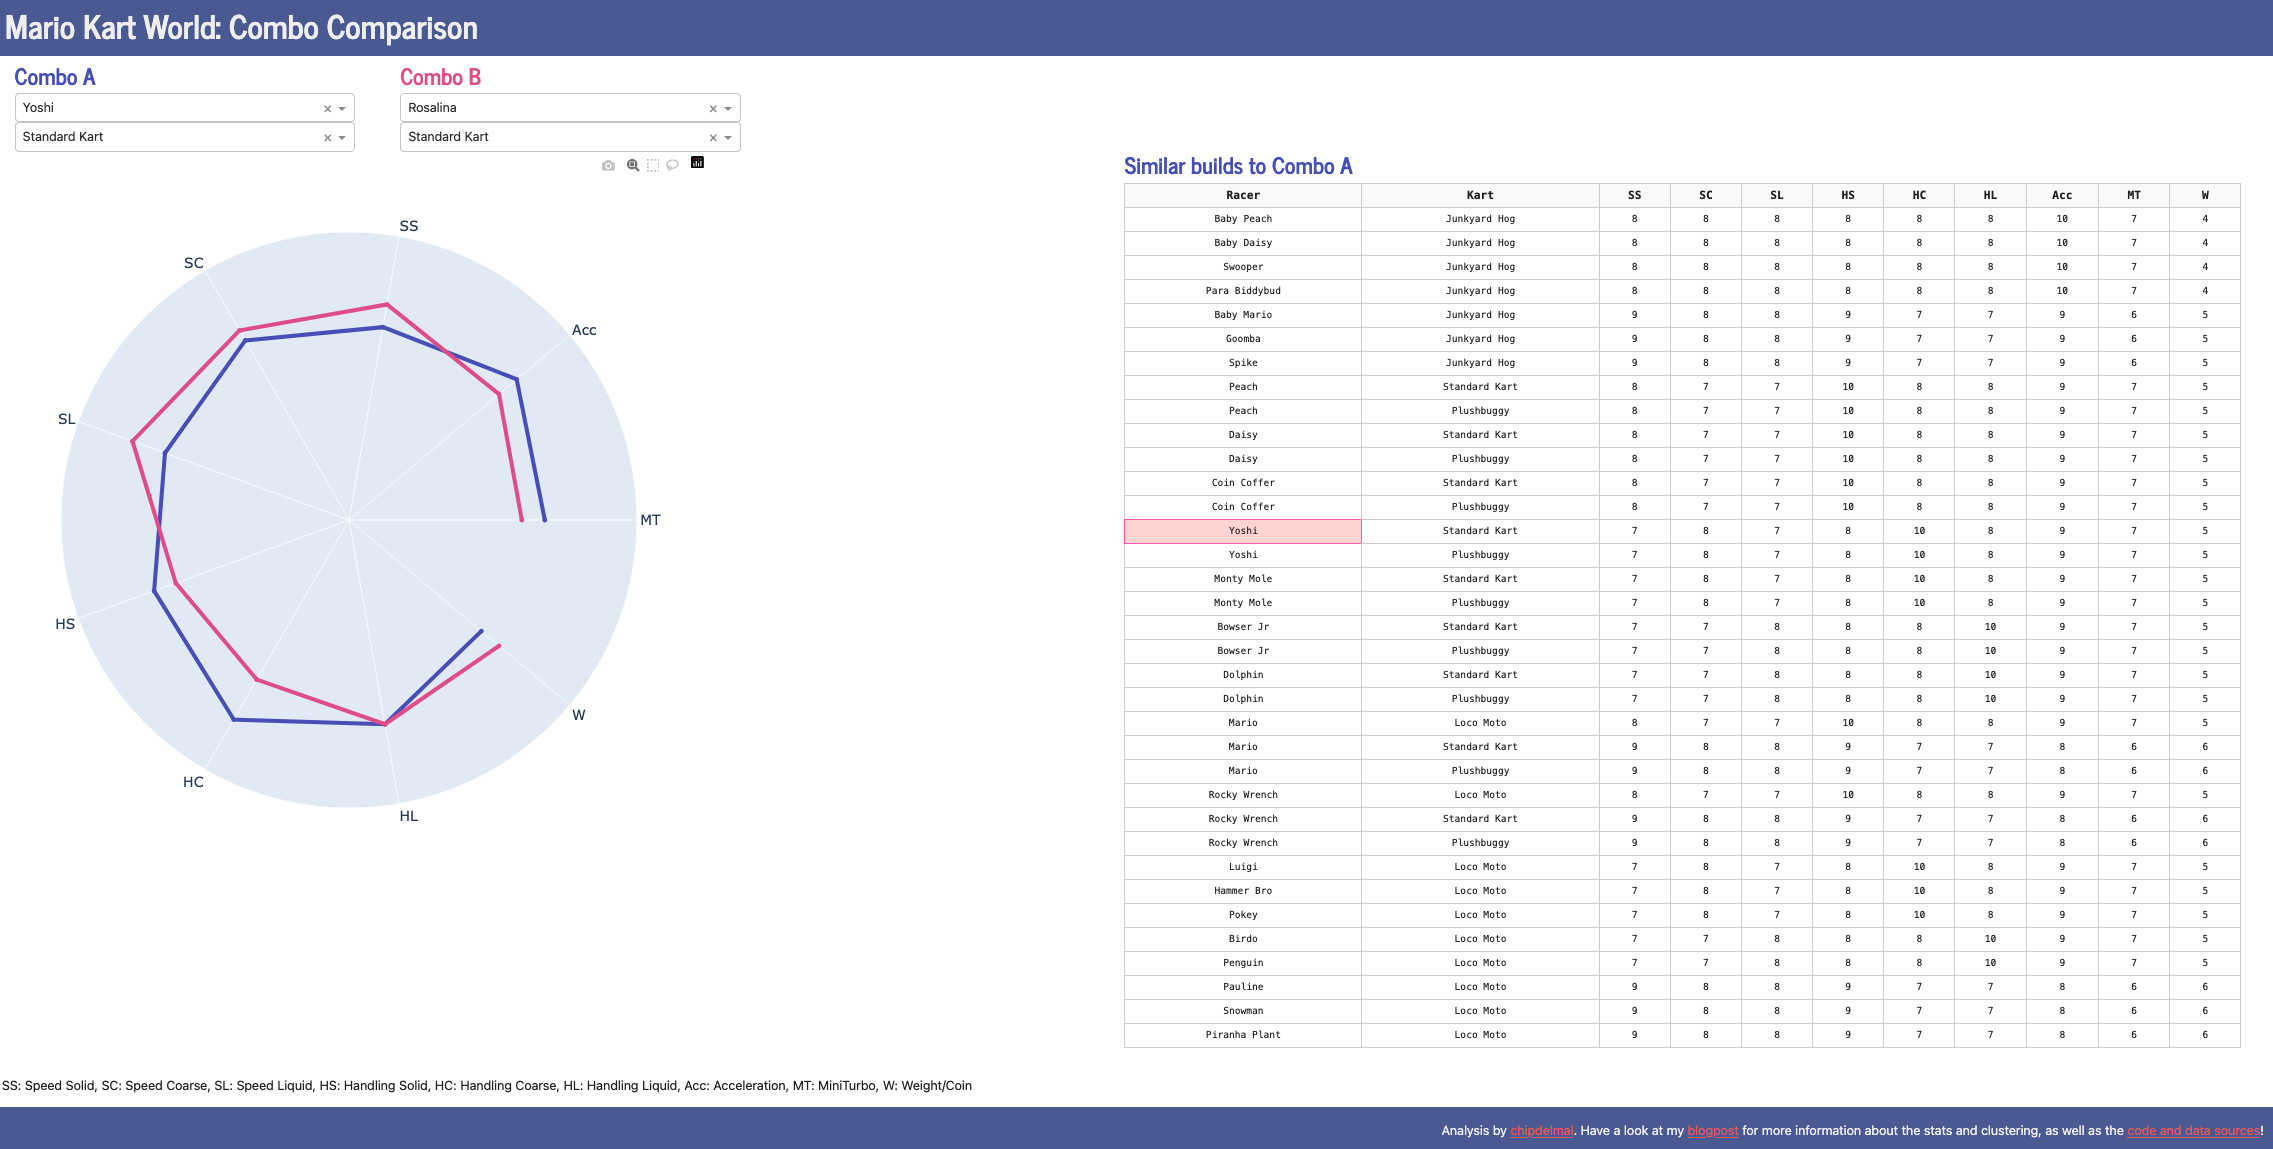
This is useful in case we want to explore some new combinations that don’t diverge too far from our current build, or if we want to see if there’s some other combinations that might be comparable with a character/kart that we like better.
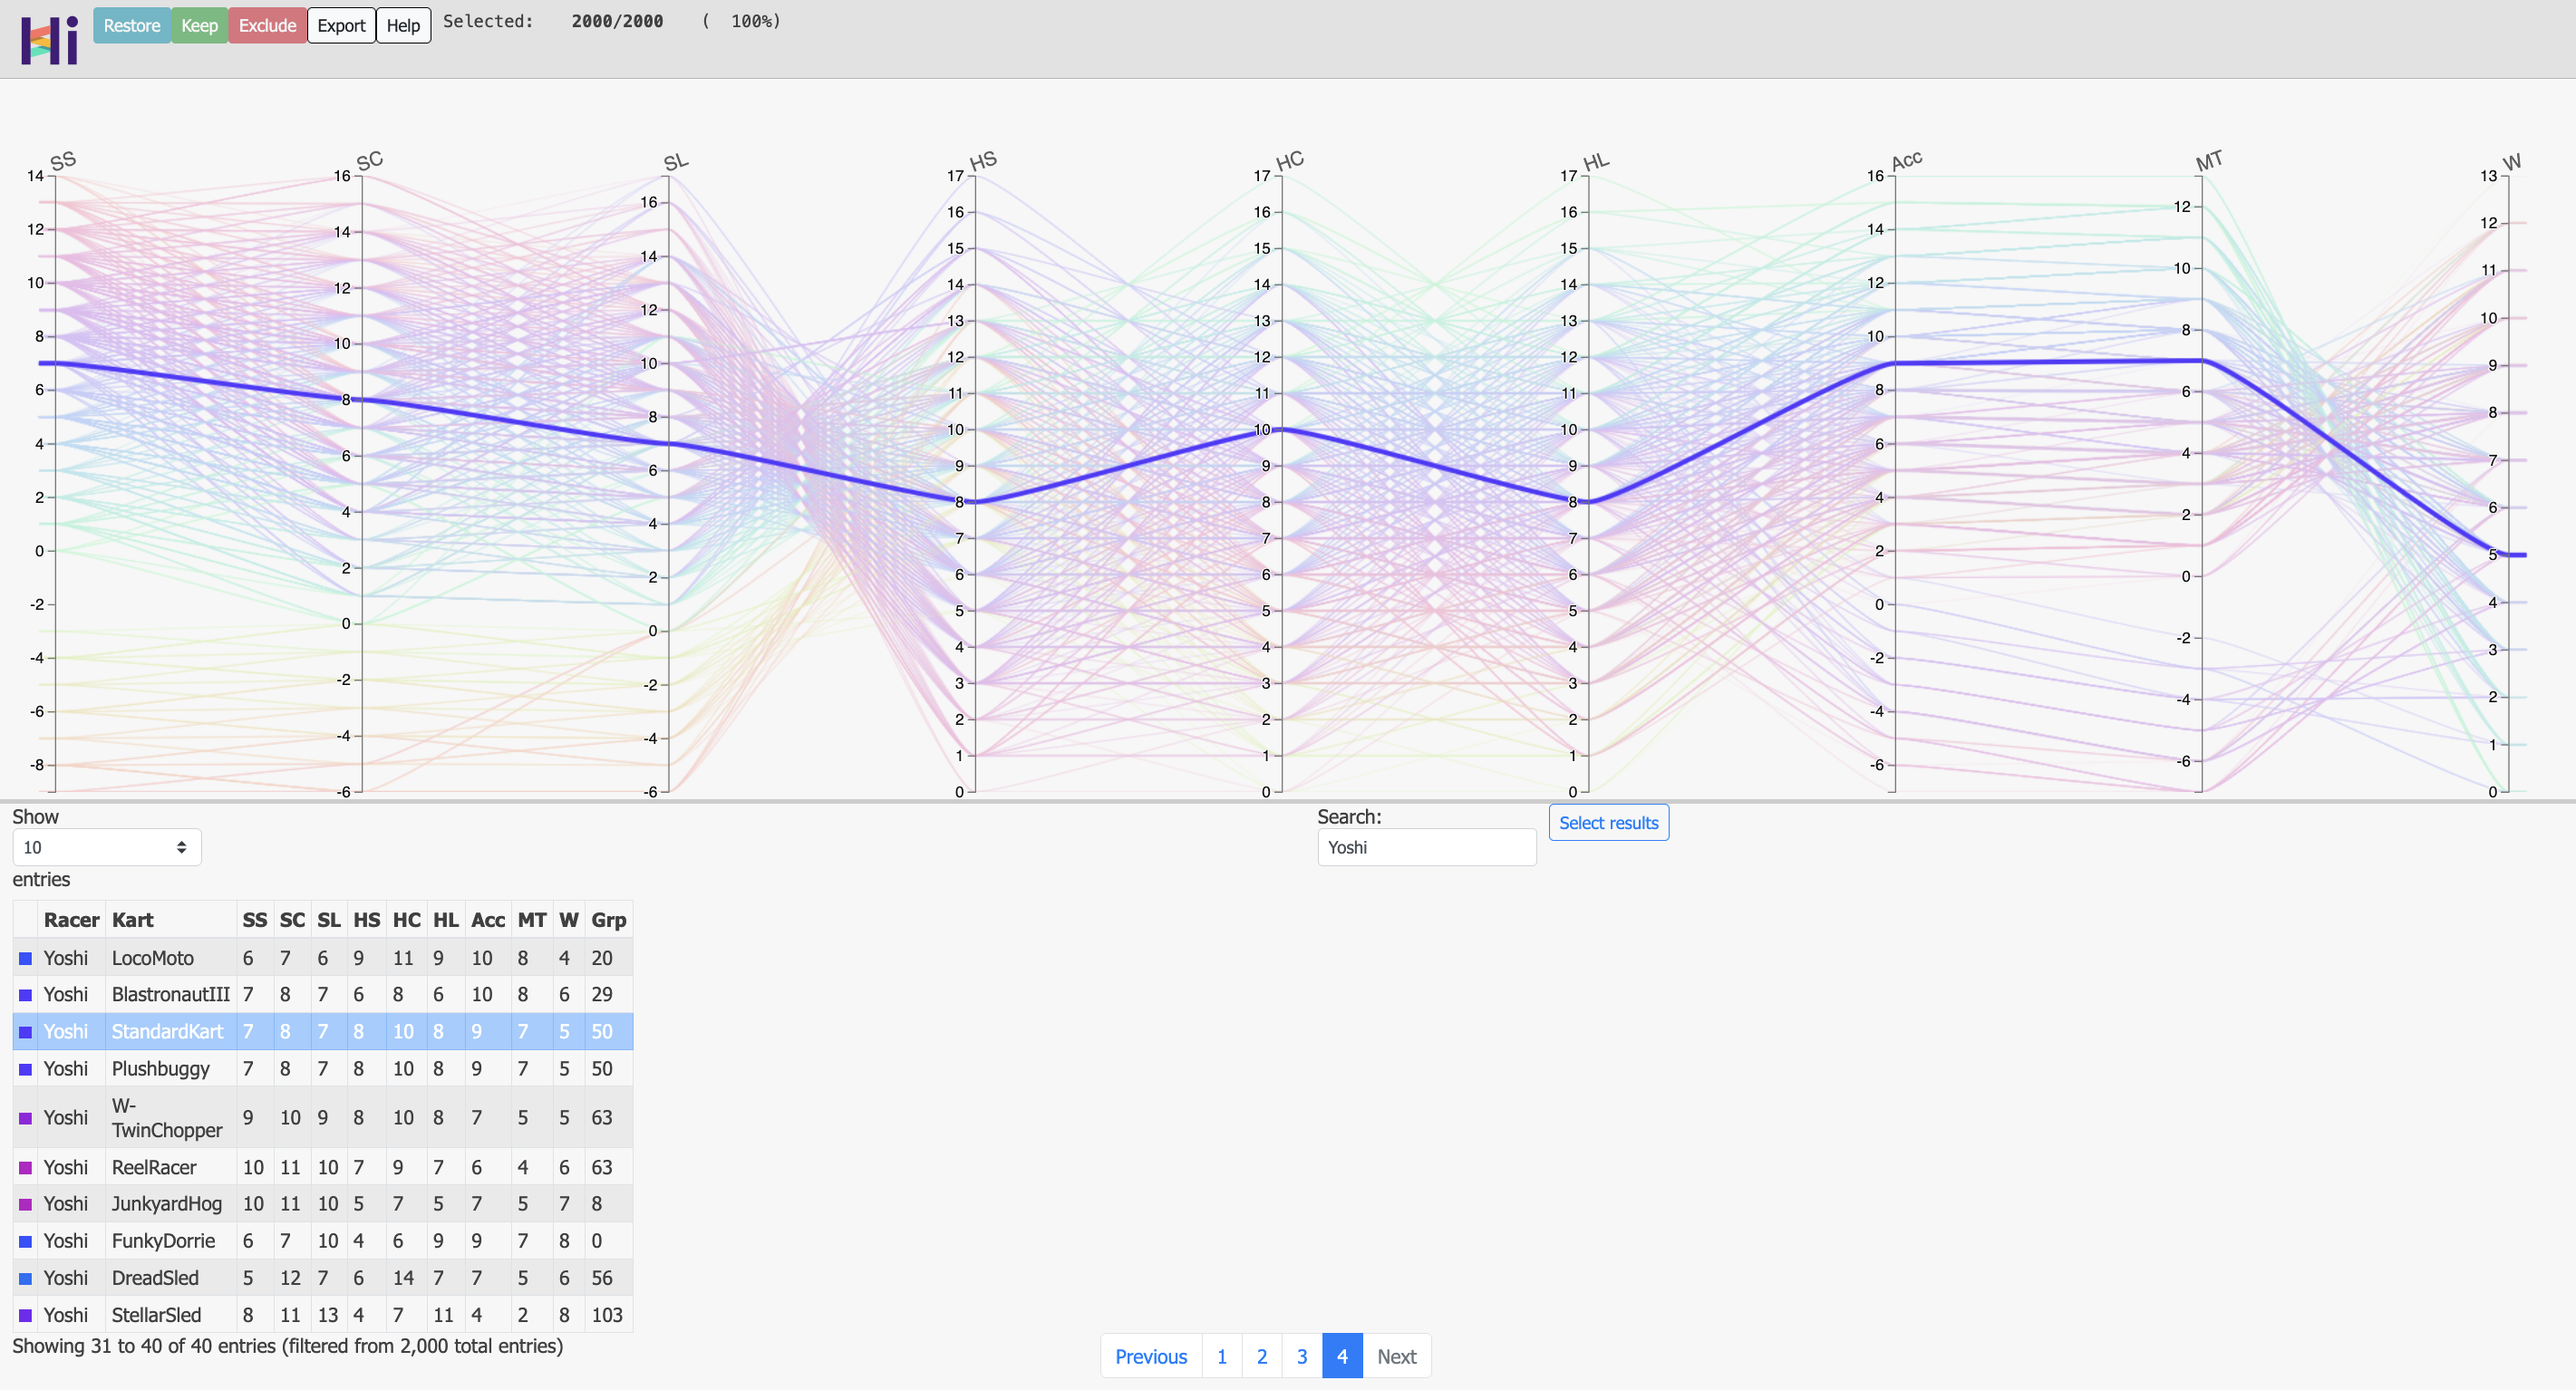
HiPlot
Another avenue I was looking into was using parallel plots to visualize the high dimensional dataset. Initially, I tried using plotly for this but it was quickly apparent that it was not good enough for the application (it was not very flexible and probably not efficient enough for 2000 traces); this is when I came across hiplot, so I decided to take it for a spin. One clear advantage of this package is that it generates a standalone HTML file that can easily be shared and embedded.
exp = hip.Experiment.from_dataframe(dfCmb.reset_index())
exp.colormap = "interpolateSinebow"
exp.display_data(hip.Displays.PARALLEL_PLOT).update({
    'hide': ['uid', 'from_uid', 'Grp', 'Kart', 'Racer'],
    'order': cSort
})
exp.display_data(hip.Displays.TABLE).update({
    'hide': ['index', 'uid', 'from_uid'],
    'order': cSort[::-1]
})
exp.display(force_full_width=True)
_ = exp.to_html(path.join(cst.PT_PLT, 'parallel.html'))
Now, the hiplot framework is quirky and a bit obscure in its documentation so I couldn’t get any custom color palette to work but here are some snapshots of the exported HTML, which can be readily downloaded and run in any browser (click on the image for a live version):
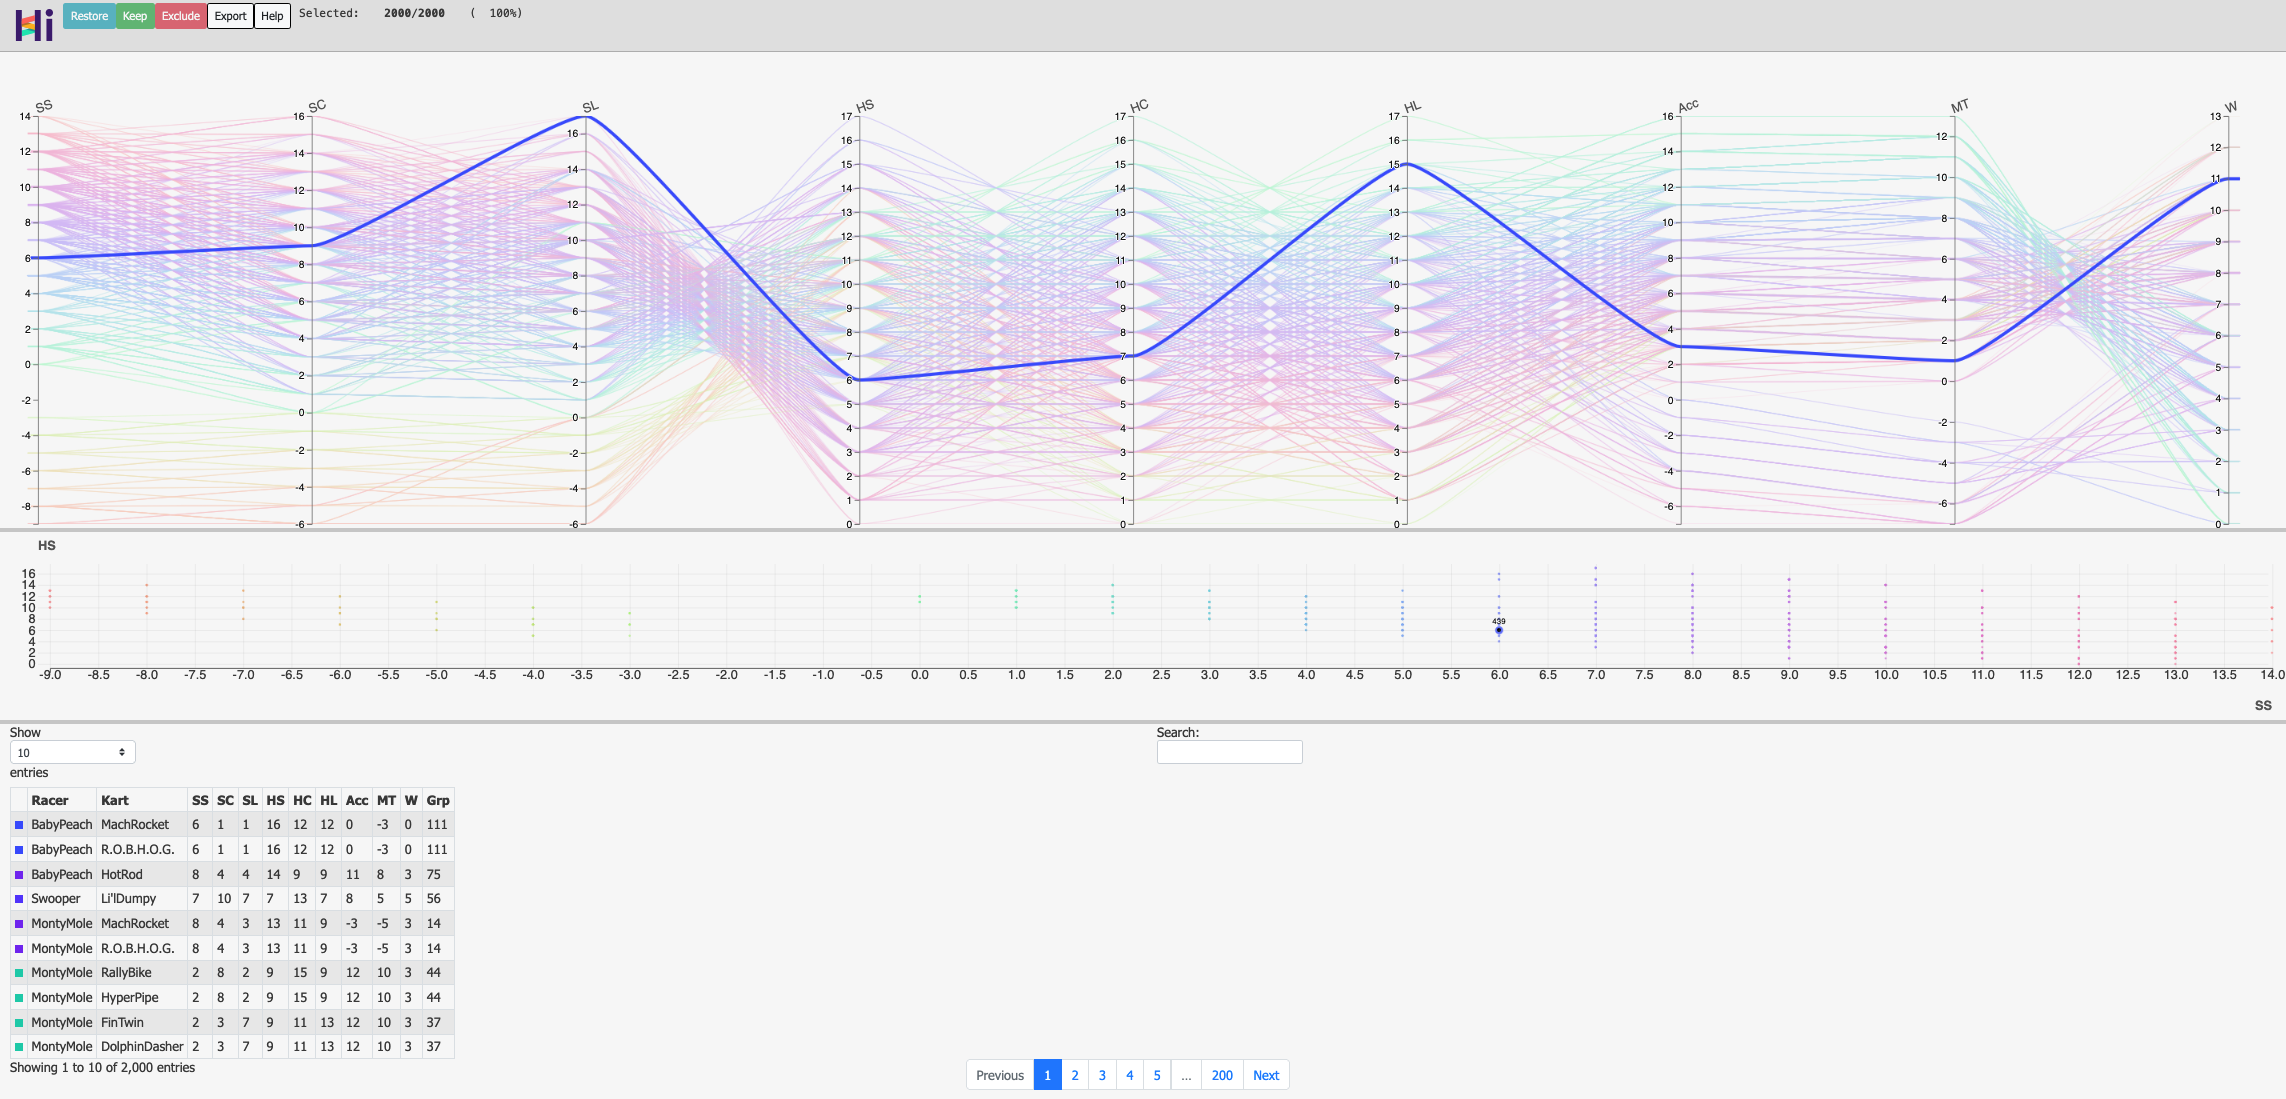
Some of the awesome features of this package are that the HTML can be filtered (by clicking and dragging in any y-axis), parallel axis can be dragged, XY scatter plots can be generated (right-clicking on the axes labels), and the table can be filtered too. The code routine can be found in this file and the interactive live version can be checked out here!
Optimum Combo?
Mario Kart World is quite different from Mario Kart 8 Deluxe in the fact that there are more hidden stats and a variety of routes/track styles. This makes for a situation in which there is no obvious pareto optimal combination, as one set can be extremely good in solid ground, but terrible in water and the performance might depend on which assortment of tracks is part of the draw. That being said, I’m quite curious on how the meta will evolve.
In terms of why I was having trouble with some cups/knockouts it was a combination of Rosalina + Baby Blooper having low speed in coarse and liquid plus low acceleration along with me just starting to get experience with the game. In the meantime, I have switched to a more versatile Yoshi + Standard Kart combination for the time being.
Future Work
I plan to make some build comparisons as time allows, specially in the time trial combinations, so stay tuned! Additionaly, one avenue I haven’t quite explored is to use the distances between the stats vectors as another way to measure similarity between combos. This would have the benefit over the clusters in that it would show us a numerical metric of separation between combinations. The calculations are already in place, so maybe in the near future I will look at this option in more detail.
Code Repo and Data Sources
- Apps: mkworld-buildcompare, HiPlot
- Repository: GitHub Repo
- Dependencies: hiplot, matplotlib, pandas, numpy, scikit-learn
- Data Sources: bento, LastExceed, CrypticJacknife, Delta, AprilShade, LBRZ, pop2pop, Luigi_Fan2, brad.wheeler