XML parser to analyze speedrun timings in MK8D.
Intro
I’ve been playing a lot of “Mario Kart 8” and “Mario Kart 8 Ultimate” for a while and in the latest years, I’ve been devoting more and more time to learning the intricacies of the game. This eventually led to attempting to speedrun the game.
I enjoy playing 200cc and no items ‘cause it feels like the outcomes are mostly based on skill, so I started my attempts at the 48 tracks category. As I dwelved deeper into the tools used to record and keep track of the timings, I realized that Livesplit exports an XML with all the timing information, so I started coding some scripts to analyze the data to track my improvement in performance.
CodeDev
XML Inspection
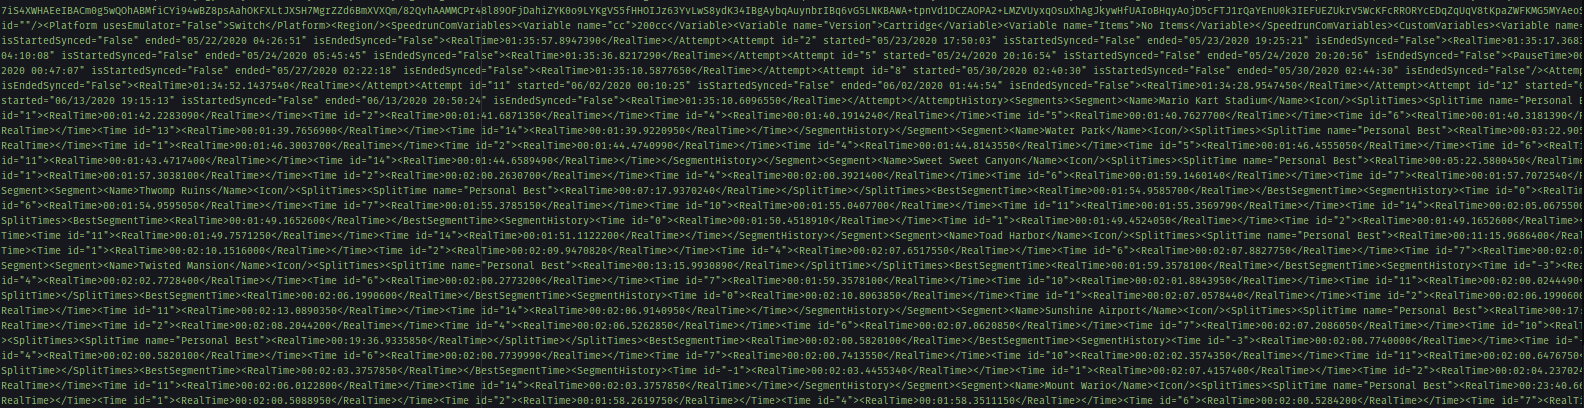
As mentioned before, I am using Livesplit to store the timing data of the splits. This software exports lss files which, upon inspection, follow the XML standard. This allows us to parse the data and plot it.
The first thing I was interested in doing was plotting the time distributions per track. In order to do this, we have to take a look at the XML structure of the document. The easiest way to do this, for me, was to transform the whole structure into a dictionary using the xmltodict. This time I won’t go deeply into the code specifics, but the XML stores the segments the following tree structure:
Run*
    @version
    GameIcon
    GameName
    CategoryName
    Metadata
        Run
        Platform
        Region
        SpeedrunComVariables
            Variable
                cc
                Version
                Cartridge
                Items
        CustomVariables
            Comment
    Offset
    AttemptCount
    AttemptHistory
        Attempt
    Segments*
        Segment*
            Name+
            Icon
            SplitTimes
                SplitTime
            BestSegmentTime
            SegmentHistory*
                Time*
                    @id+
                    RealTime*
The path we want to follow is the one marked by asterisks, as it leads us to all the timing data of each attempt on each split. To calculate the time distributions and stats, we go through all the RealTime elements of the tracks:
Run/Segments/Segment/Name
Run/Segments/Segment/SegmentHistory/Time/RealTime
Violin plot
After parsing these timings, we convert them into seconds and store them into lists and feed them to matplotlib’s violinplot. With a lot of restyling, we get the following plot, showing the distributions of time for each one of the segments:
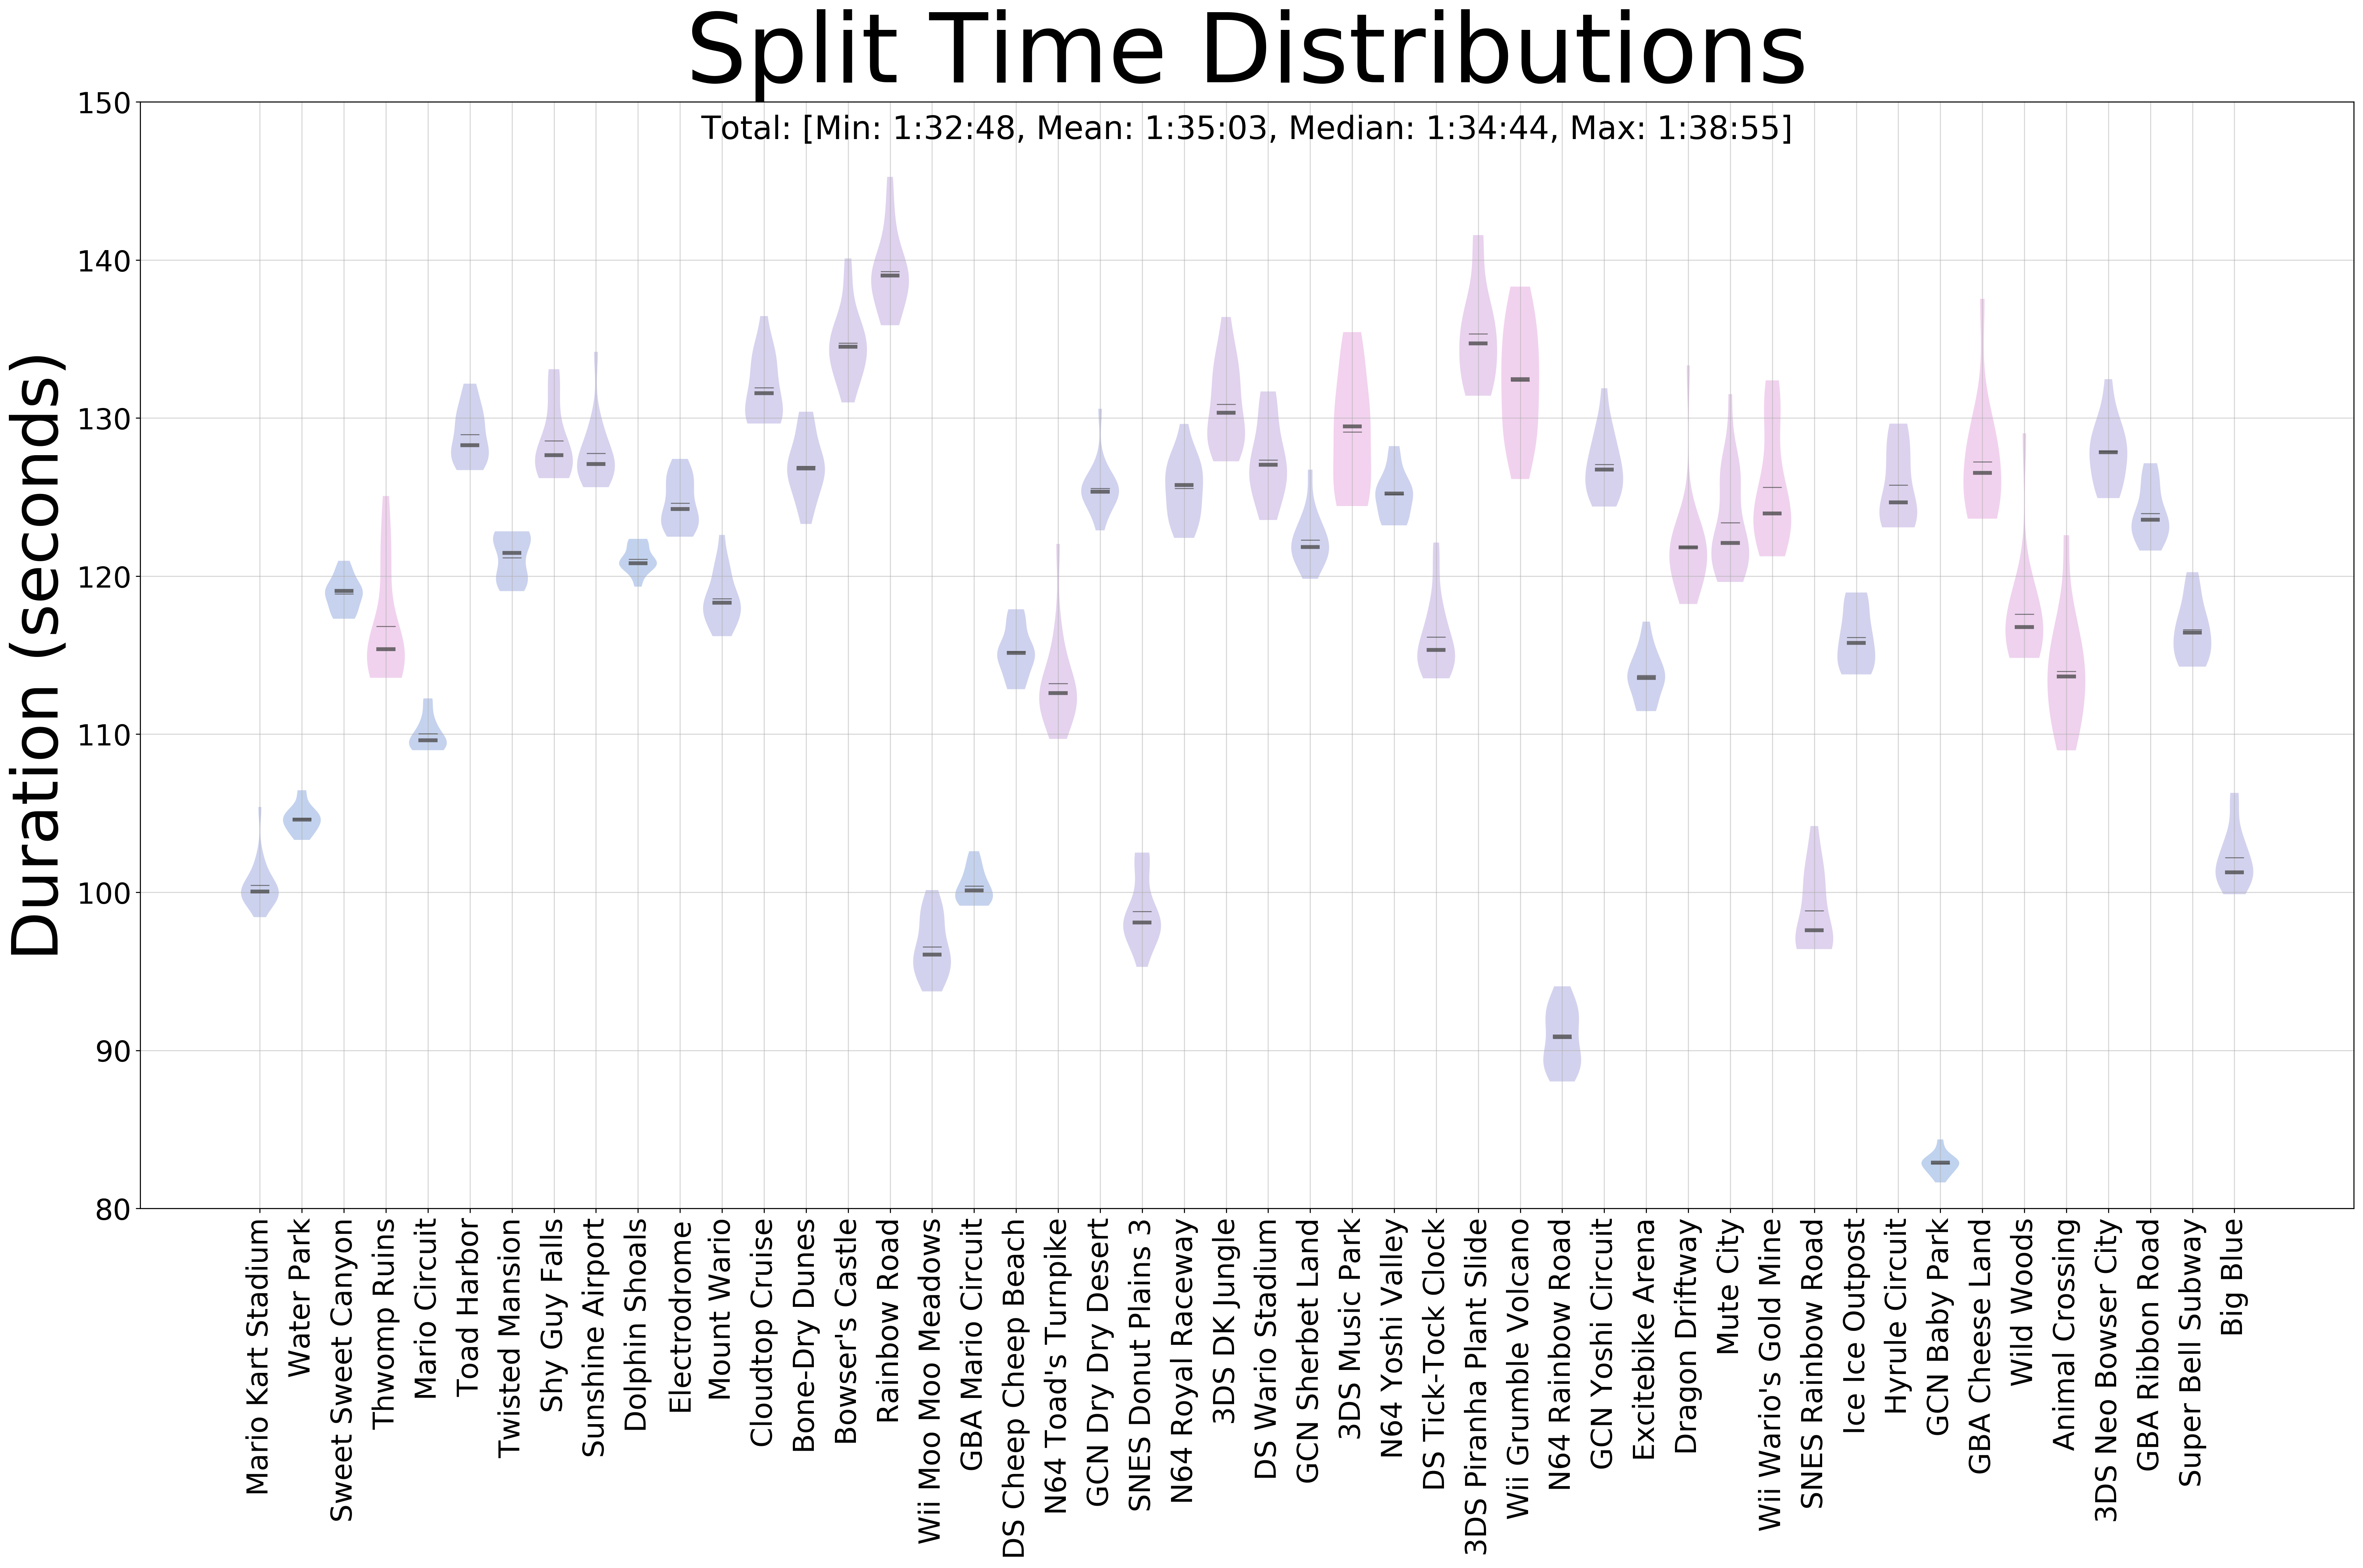
Traces plot
This plot shows me which tracks I have to practice the most, as the ones with the most deviation (elongated symmetrical shapes) would be the ones in which I have the most probabilities to save/lose time.
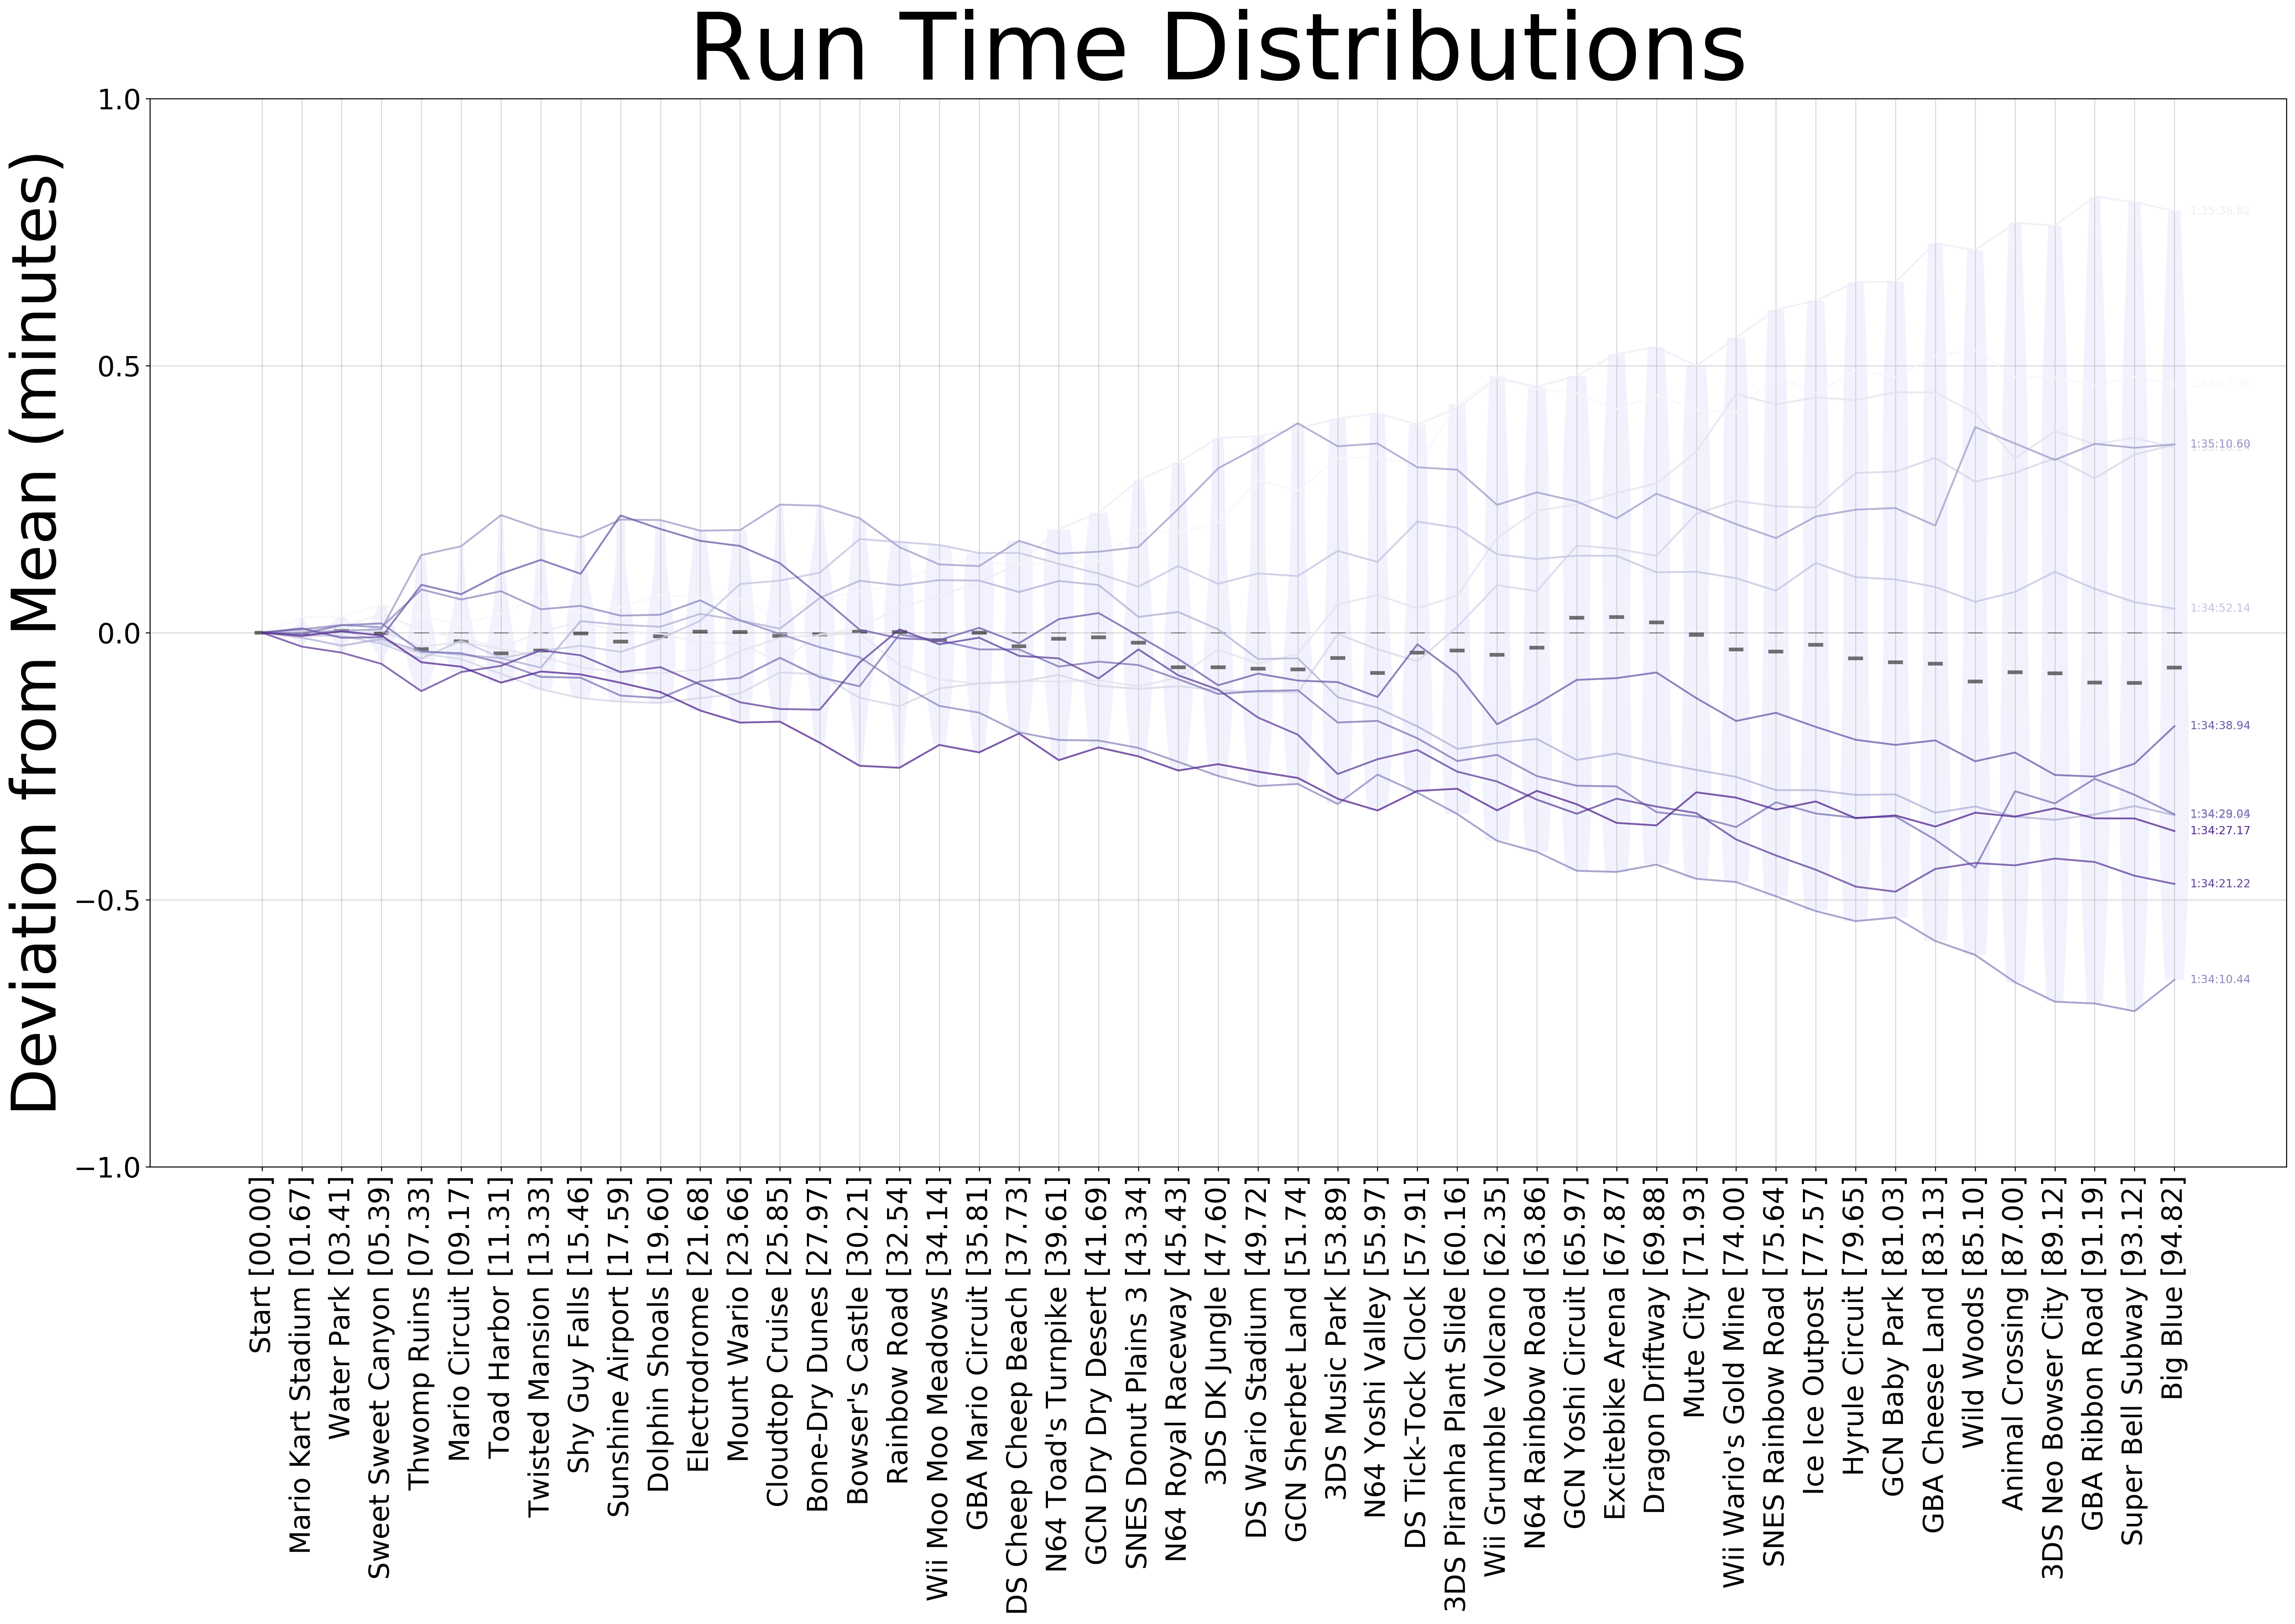
The second plot I wanted to make, was one that showed me each finished run attempt over time. To achieve this, we need to get the id tags for each one of the finished runs, so we first analyze the last split, and then we run through the rest of the splits but only store the ones with ids that match the ones on the finished set. If we do this without any further processing, however, we end up with a plot that is not very useful, as we just have a bunch of lines going upwards in time. To make this better, we can calculate the mean in each split and subtract the timings of each run by the median. This centers the plot over the y-axis. Even with this, the plot still needed some work. To emphasize the most recent runs, we can use a colormap, so that older runs appear lighter in color. Additionally, we can add the violin plots for each split, and the median marker (the median being 0 in our shifted frame of reference). In order to still be able to retrieve the absolute timing information from the plot, we can add the mean to the x-axis labels and the final timing at the end of each trace:
Further thoughts
I still need to clean up my code and make some improvements in the scripts, but I’ve found the plots pretty useful in practicing my runs. The single track distributions help me point out where I can save the most time on my runs, whilst the run time distributions one helps me understand which tracks I’ve improved over time (the ones with newer runst trending downwards and median being lower than the mean).
Code Repo
- Repository: Github repo
- Dependencies: xmltodict, matplotlib