Comparing stat.ink Splatoon weapons’ performance.
Intro
Splatoon’s community has clear preferences on some weapons to others in the competitive scene (with “Splash-o-matic”, for example, being a favorite in most team compositions). Given that Stat.ink provides the information of battles uploaded by players, and that I had already coded some routines to parse these data into manageable dataframes for further analysis (as described in my previous post); I wanted to check how weapons rank against each other in terms if win/loss ratios. In this post I go through the generation of a “dominance matrix”, where we can analyze and compare weapons’ performance against each other.
Code Dev
This code assumes the battles data has already been loaded as described in the stat.ink post.
Dominance Matrix
To get started we get the total number of battles, who won the match (each entry defaults to True if team alpha won), and the weapons used by each team:
btlsNum = btls.shape[0]
# Get weapons used by each team
tmsWpns = getTeamsWeapons(btls)
(alpha, bravo) = (tmsWpns['alpha'], tmsWpns['bravo'])
# Get the winner of the match
winAlpha = list(btls['win'])
Next, we the list of weapons that appear in the whole dataset:
wNames = getWeaponsSet(btls)
wpnsNumbr = len(wNames)
Now comes the fun part. The goal is to generate a squared matrix that will contain the information of how many times a given weapon (row) has beaten another weapon (column) in a match. The order of the appearance of the weapons in the matrix (row-column) corresponds to the sorting in the wNames list, which is alphabetical by default (although a list can be provided to the function, if so desired). With this in mind, we iterate over each match (controlled by the battle index bix) where we get the positions of the weapons on both teams, and who won the match. If alpha won, we iterate over their weapons’ rows incrementing by one all of the columns that correspond to a weapon that exists in team bravo; conversely, if bravo won, we go through all of the rows of the teams’ weapons and increment the columns corresponding to the ones in alpha by one:
# Initialize empty matrix
domMtx = np.zeros((wpnsNumbr, wpnsNumbr), dtype=np.uint32)
for bix in range(btlsNum):
    # Get names for weapons in both teams
    (wpnsNmA, wpnsNmB) = (list(alpha.iloc[bix]), list(bravo.iloc[bix]))
    # Get indices for weapons in both teams
    (wpnsIxA, wpnsIxB) = (
        [wNames.index(w) for w in wpnsNmA],
        [wNames.index(w) for w in wpnsNmB]
    )
    # Fill the corresponding row/column combination
    if winAlpha[bix]:
        # Team Alpha won
        for ixA in wpnsIxA:
            for ixB in wpnsIxB:
                domMtx[ixA, ixB] = domMtx[ixA, ixB]+1
    else:
        # Team Bravo won
        for ixB in wpnsIxB:
            for ixA in wpnsIxA:
                domMtx[ixB, ixA] = domMtx[ixB, ixA]+1
As an example, let’s inspect a single match and how it gets converted to the frequency matrix. We get the dataframe entry, inspect the match’s weapons, and who won:
match = btls.iloc[0:1]
(weapons, alphaWon) = (splat.getTeamsWeapons(match), match['win'])
(weapons['alpha'], weapons['bravo'], alphaWon)
###############################################################################
# out:
###############################################################################
    (
      A1-weapon       "Z+F Splat Charger"
      A2-weapon     "Neo Sploosh-o-matic"
      A3-weapon          "Splash-o-matic"
      A4-weapon          "Splash-o-matic"
      Name: 0, dtype: object,

      B1-weapon          "Splash-o-matic"
      B2-weapon  "Forge Splattershot Pro"
      B3-weapon                "N-ZAP 89"
      B4-weapon     "Tri-Slosher Nouveau"
      Name: 0, dtype: object,

      False
    )
Ok, so we have the weapons used by both teams, and we can see that team bravo won. Now, let’s calculate dominance matrix of the match:
splat.calculateDominanceMatrix(btls.iloc[0:1])
###############################################################################
# out:
###############################################################################
    (
      [
        "Forge Splattershot Pro",
        "N-ZAP '89",
        "Neo Sploosh-o-matic",
        "Splash-o-matic",
        "Tri-Slosher Nouveau",
        "Z+F Splat Charger"
      ],
      array([
        [0, 0, 1, 2, 0, 1],
        [0, 0, 1, 2, 0, 1],
        [0, 0, 0, 0, 0, 0],
        [0, 0, 1, 2, 0, 1],
        [0, 0, 1, 2, 0, 1],
        [0, 0, 0, 0, 0, 0]
      ])
    )
Let us have a look at the “Forge Splattershot Pro”. This weapon, which has an index 0 in the matrix, was part of team bravo (the winning team), so its row should have positive entries in the columns that match the weapons used by team alpha (as presented in the wNames list). We can see that its row has a one in the second column, which corresponds to the “Neo Sploosh-o-matic”, a 2 in the third column for the two “Splash-o-matic”s present in the opossing team, and a 1 in the last column for the “Z+F Splat Charger”. In contrast, let’s have a look at a weapon the “New Sploosh-o-matic”. This weapon’s row (index 2) is empty but its column (same index 2) has a value of 2 in the rows of the weapons used by team alpha (0, 1, 3, and 4).
When the dominance matrix function is fed a whole dataframe of matches, it repeats the same process for all the battles and weapons; which results in a large squared and assymetric matrix with the winning frequencies for the combinations that have appeared over the dataset.
Normalized Matrix
Having already calculated our frequency matrix, we can normalize the results so that the entries are fractions of wins/losses between the weapons. Doing this is relatively easy, as we can take a weapon’s row vector, and divide it by its column vector (as they are sorted in the same order). In an extra step, we subtract 1 to each entry so that it centers around 0, meaning that 0 would represent neither weapon “dominates” the other one, while positive numbers mean the weapon in the row dominates the one in the column and negative numbers represent the inverse case.
# Initialize matrix
mSize = len(domMtx)
tauW = np.zeros((mSize, mSize))
# Iterate through rows
for (ix, _) in enumerate(wNames):
    winsDiff = domMtx[ix]/domMtx[:,ix]
    tauW[ix] = winsDiff
tauX = np.nan_to_num(tauW)-1
Finally, in an optional step, we can sort the matrix by the rank frequency of weapons that each entry dominates (the reason for doing this will become clearer when we plot the results):
sorting = list(np.argsort([np.sum(r>0) for r in tauX]))[::-1]
(tauS, namS) = (tauX[sorting][:,sorting], [wNames[i] for i in sorting])
Dominance Plot
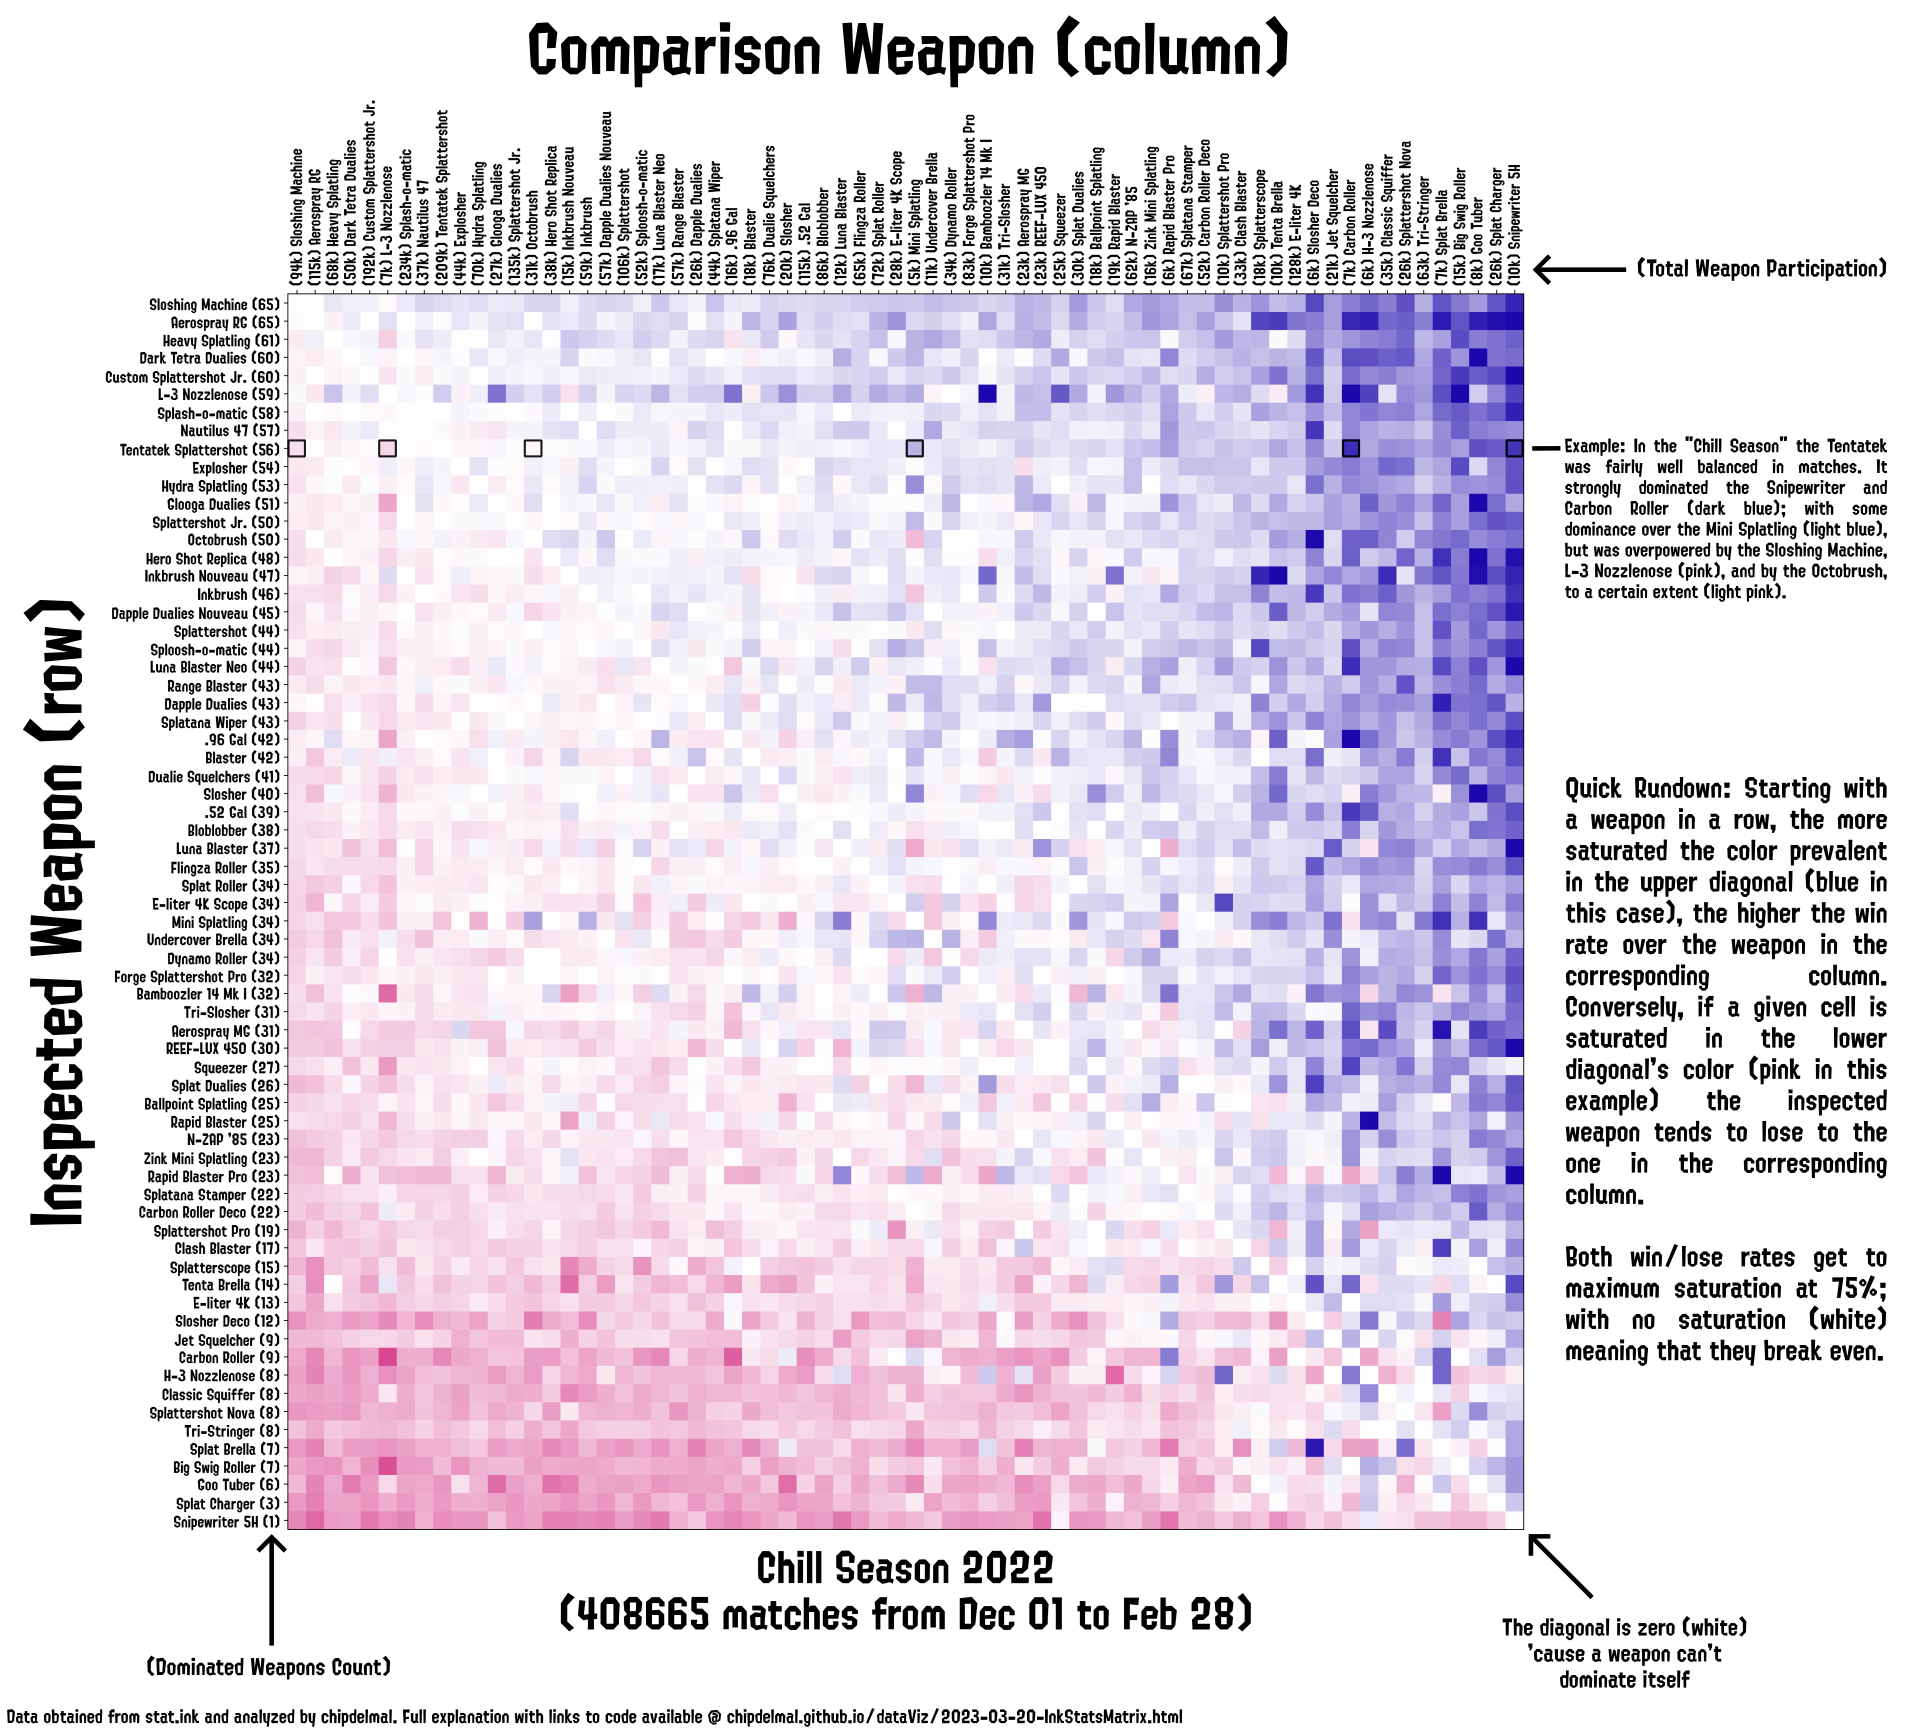
We are finally ready to generate our visualization. Thankfully, we took enough steps in our previous processes as to make this quite easy. In essence, we are simply doing a matrix plot, capping the minimum/maximum allowed values and applying a custom colorscale in the form of:
(fig, ax) = plt.subplots(figsize=(20, 20))
ax.matshow(
    sMatrix,
    vmin=-0.75, vmax=0.75,
    cmap=splat.colorPaletteFromHexList(['#D01D79', '#FFFFFF', '#1D07AC'])
)
A heuristically-good value for the values range is (-0.75, +0.75) for season-span datasets, with duotone colormaps that go through white at value 0 being good for contrasting the win/loss ratios. Now, we want to add some more information to this visualization so that we have enough context to make comparisons. This information includes the total weapons’ participation (wins + losses), and the number of times the W/L ratio against a weapon is above 1 (any positive numbers in our matrix’s row as we re-centered it around 0):
# Getting total participation per weapon
(mWpnWins, mWpnLoss) = (
    np.sum(mMatrix, axis=1)/4,
    np.sum(mMatrix, axis=0)/4
)
tVect = (mWpnWins+mWpnLoss)[sSort]
# Getting total dominance count per weapon
domCounts = [np.sum(r>0) for r in sMatrix]
We will add this information in the x and y tick-axes labels, so we generate our strings with the weapons names (sNames) and the data:
lLabs = [
    '{} ({})'.format(wn, dc)
    for (w, dc) in zip(sNames, domCounts)
]
tLabs = [
    '({}) {}'.format(tm, wn)
    for (wn, tm) in zip(sNames, [int(i) for i in tVect])
]
And simply replace the strings in their corresponding tick positions:
ax.set_xticks(np.arange(0, len(sNames)))
ax.set_yticks(np.arange(0, len(sNames)))
ax.set_xticklabels(tLabs, rotation=90, fontsize=12.5)
ax.set_yticklabels(lLabs, fontsize=12.5)
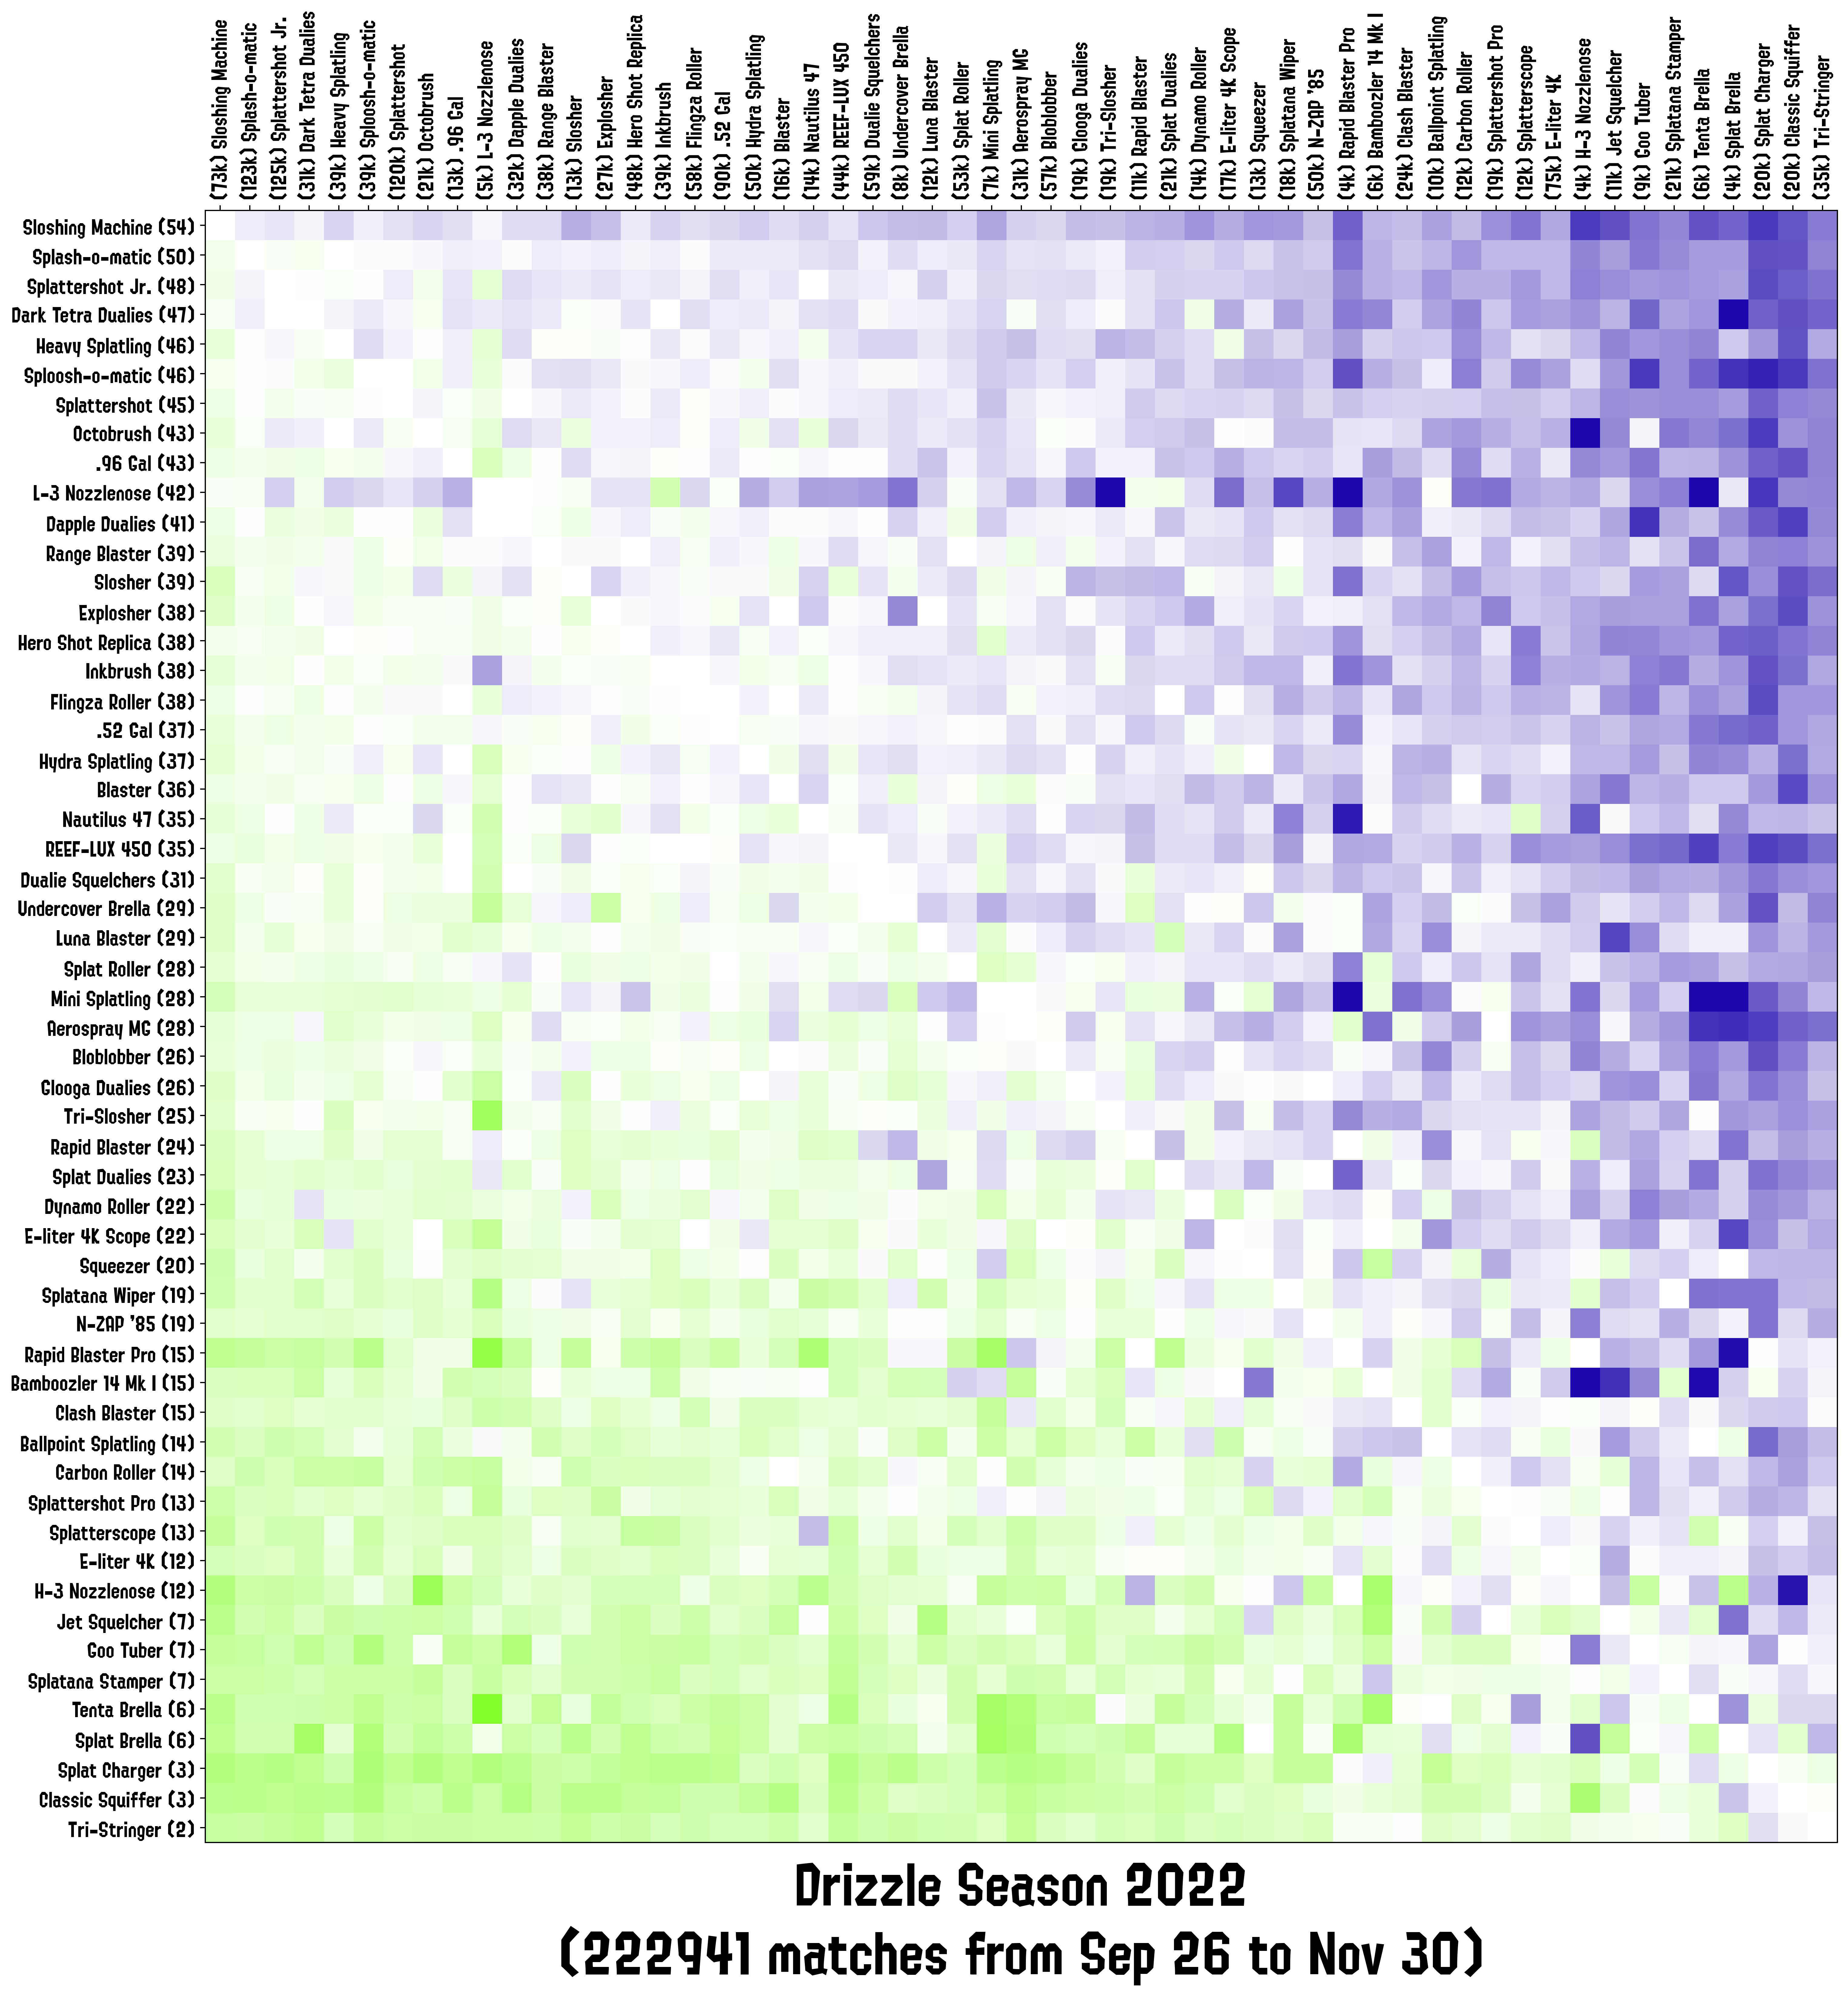
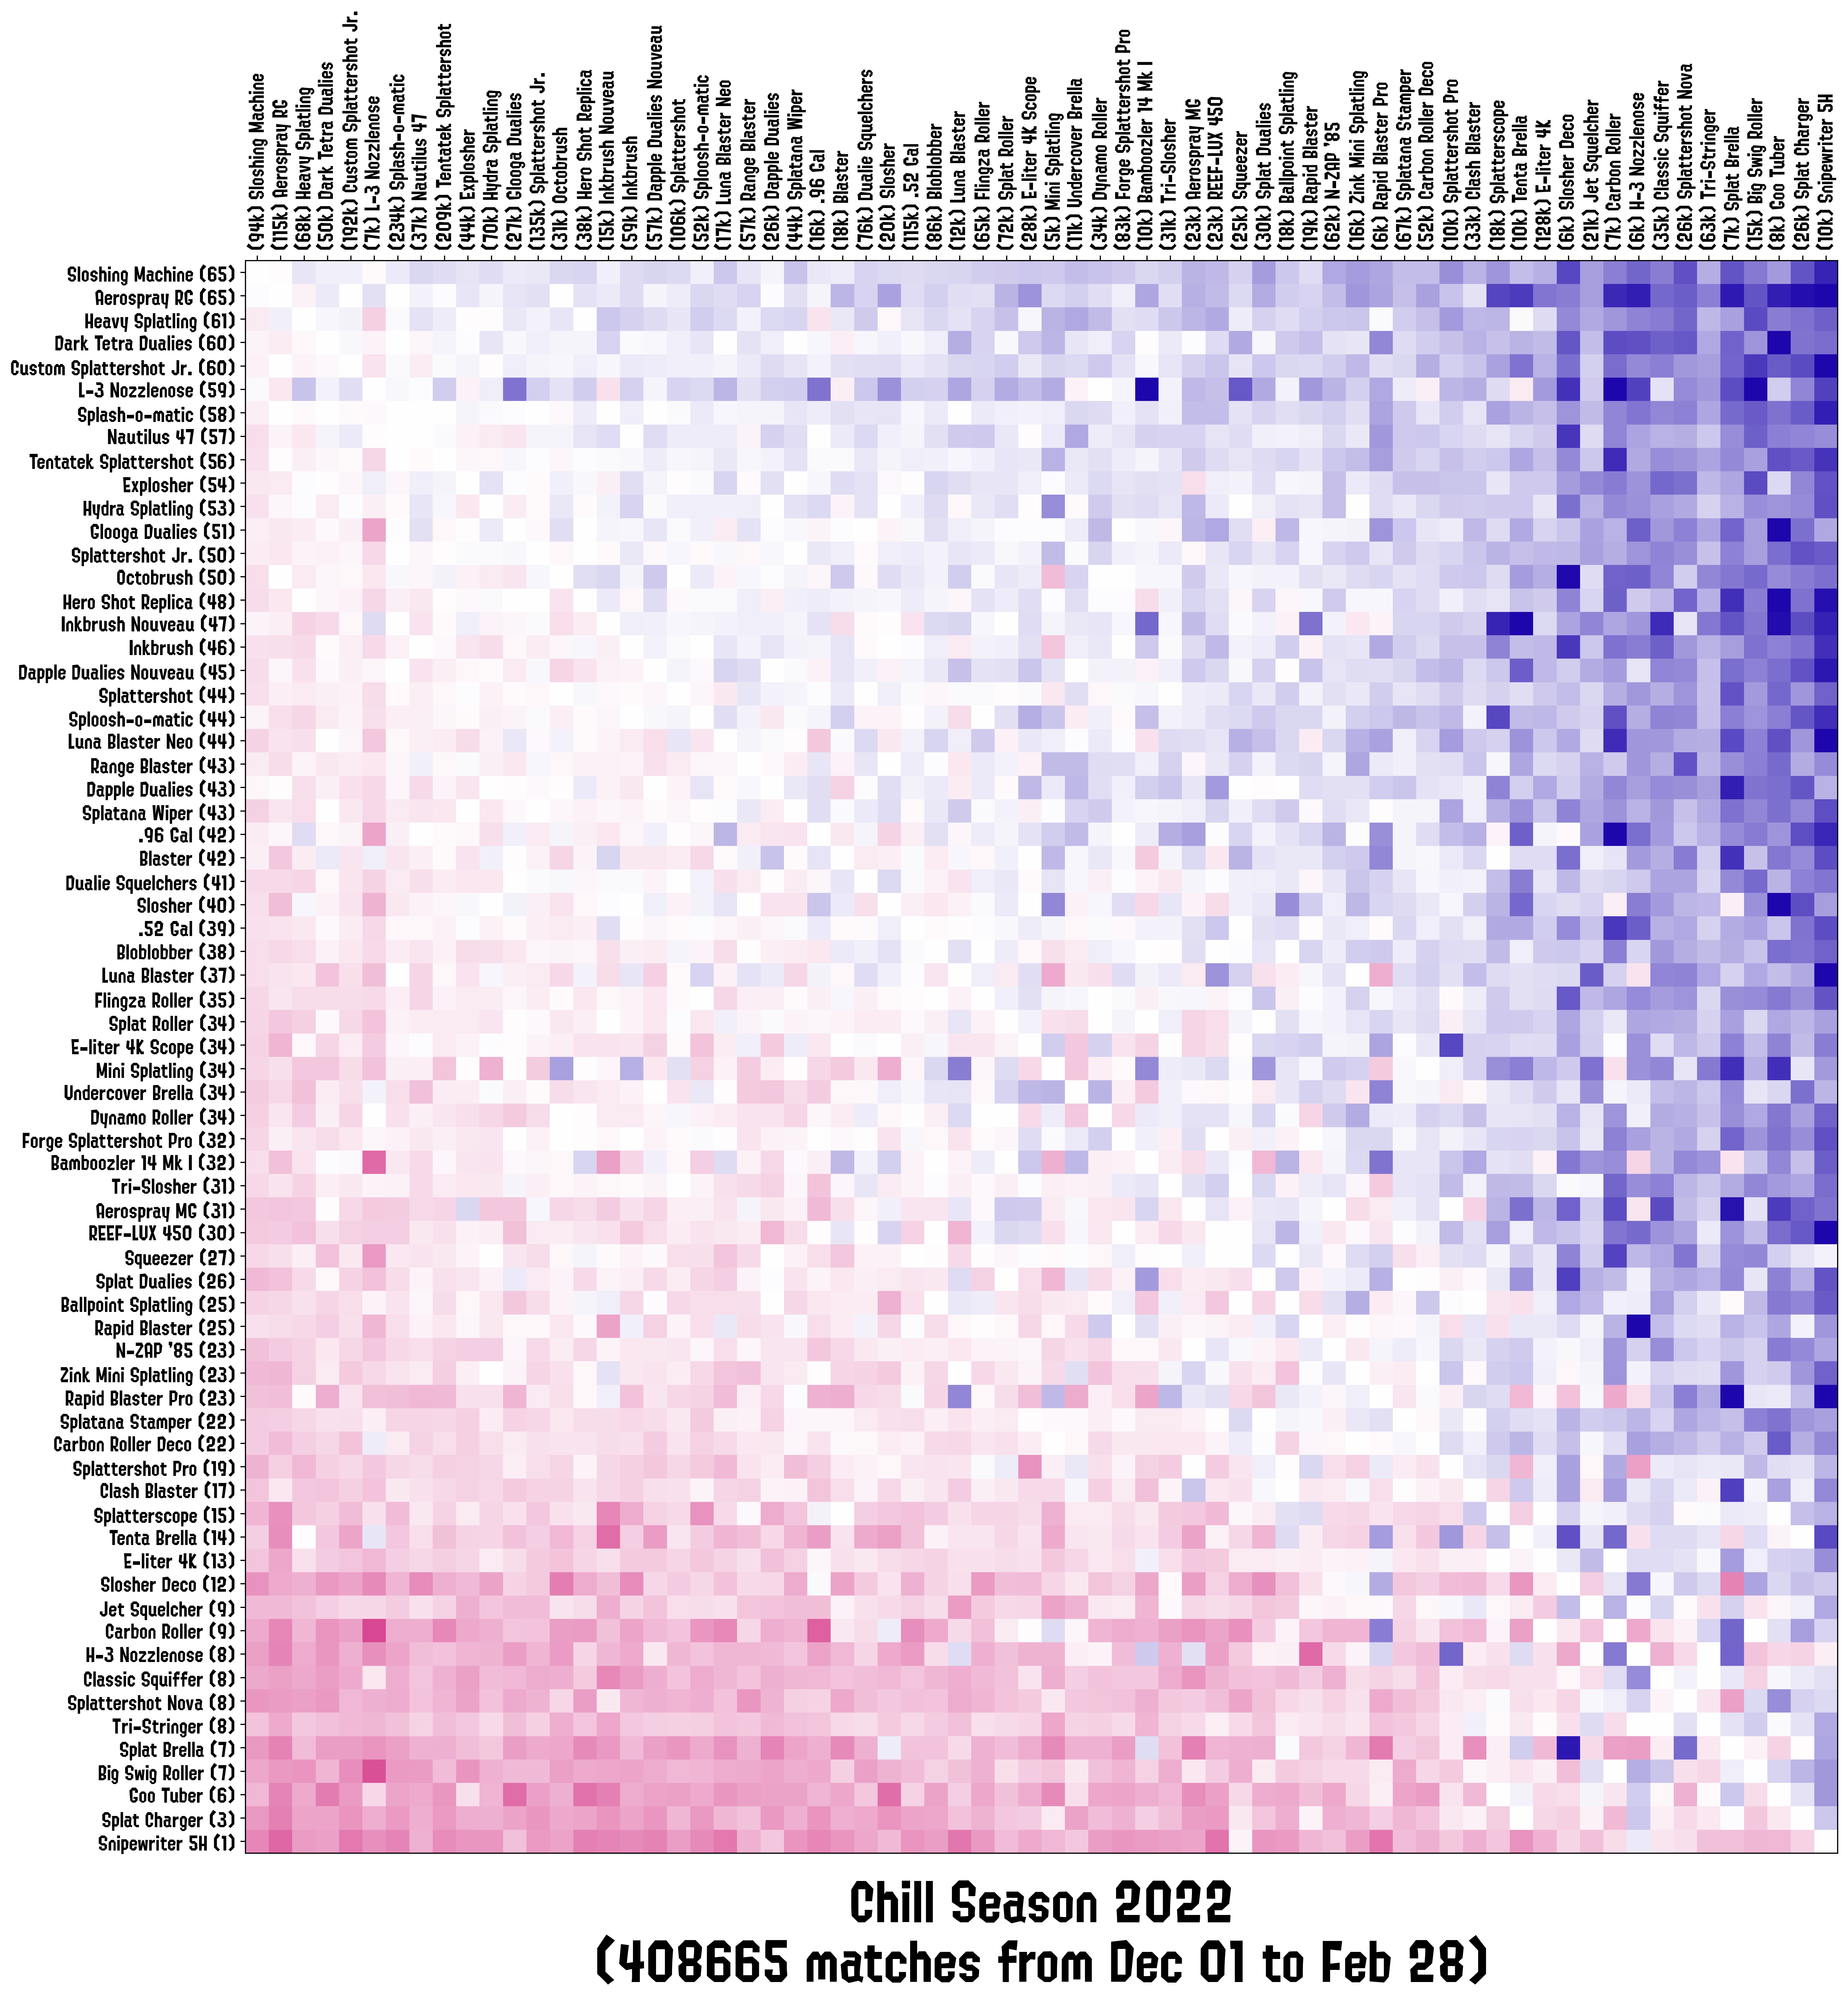
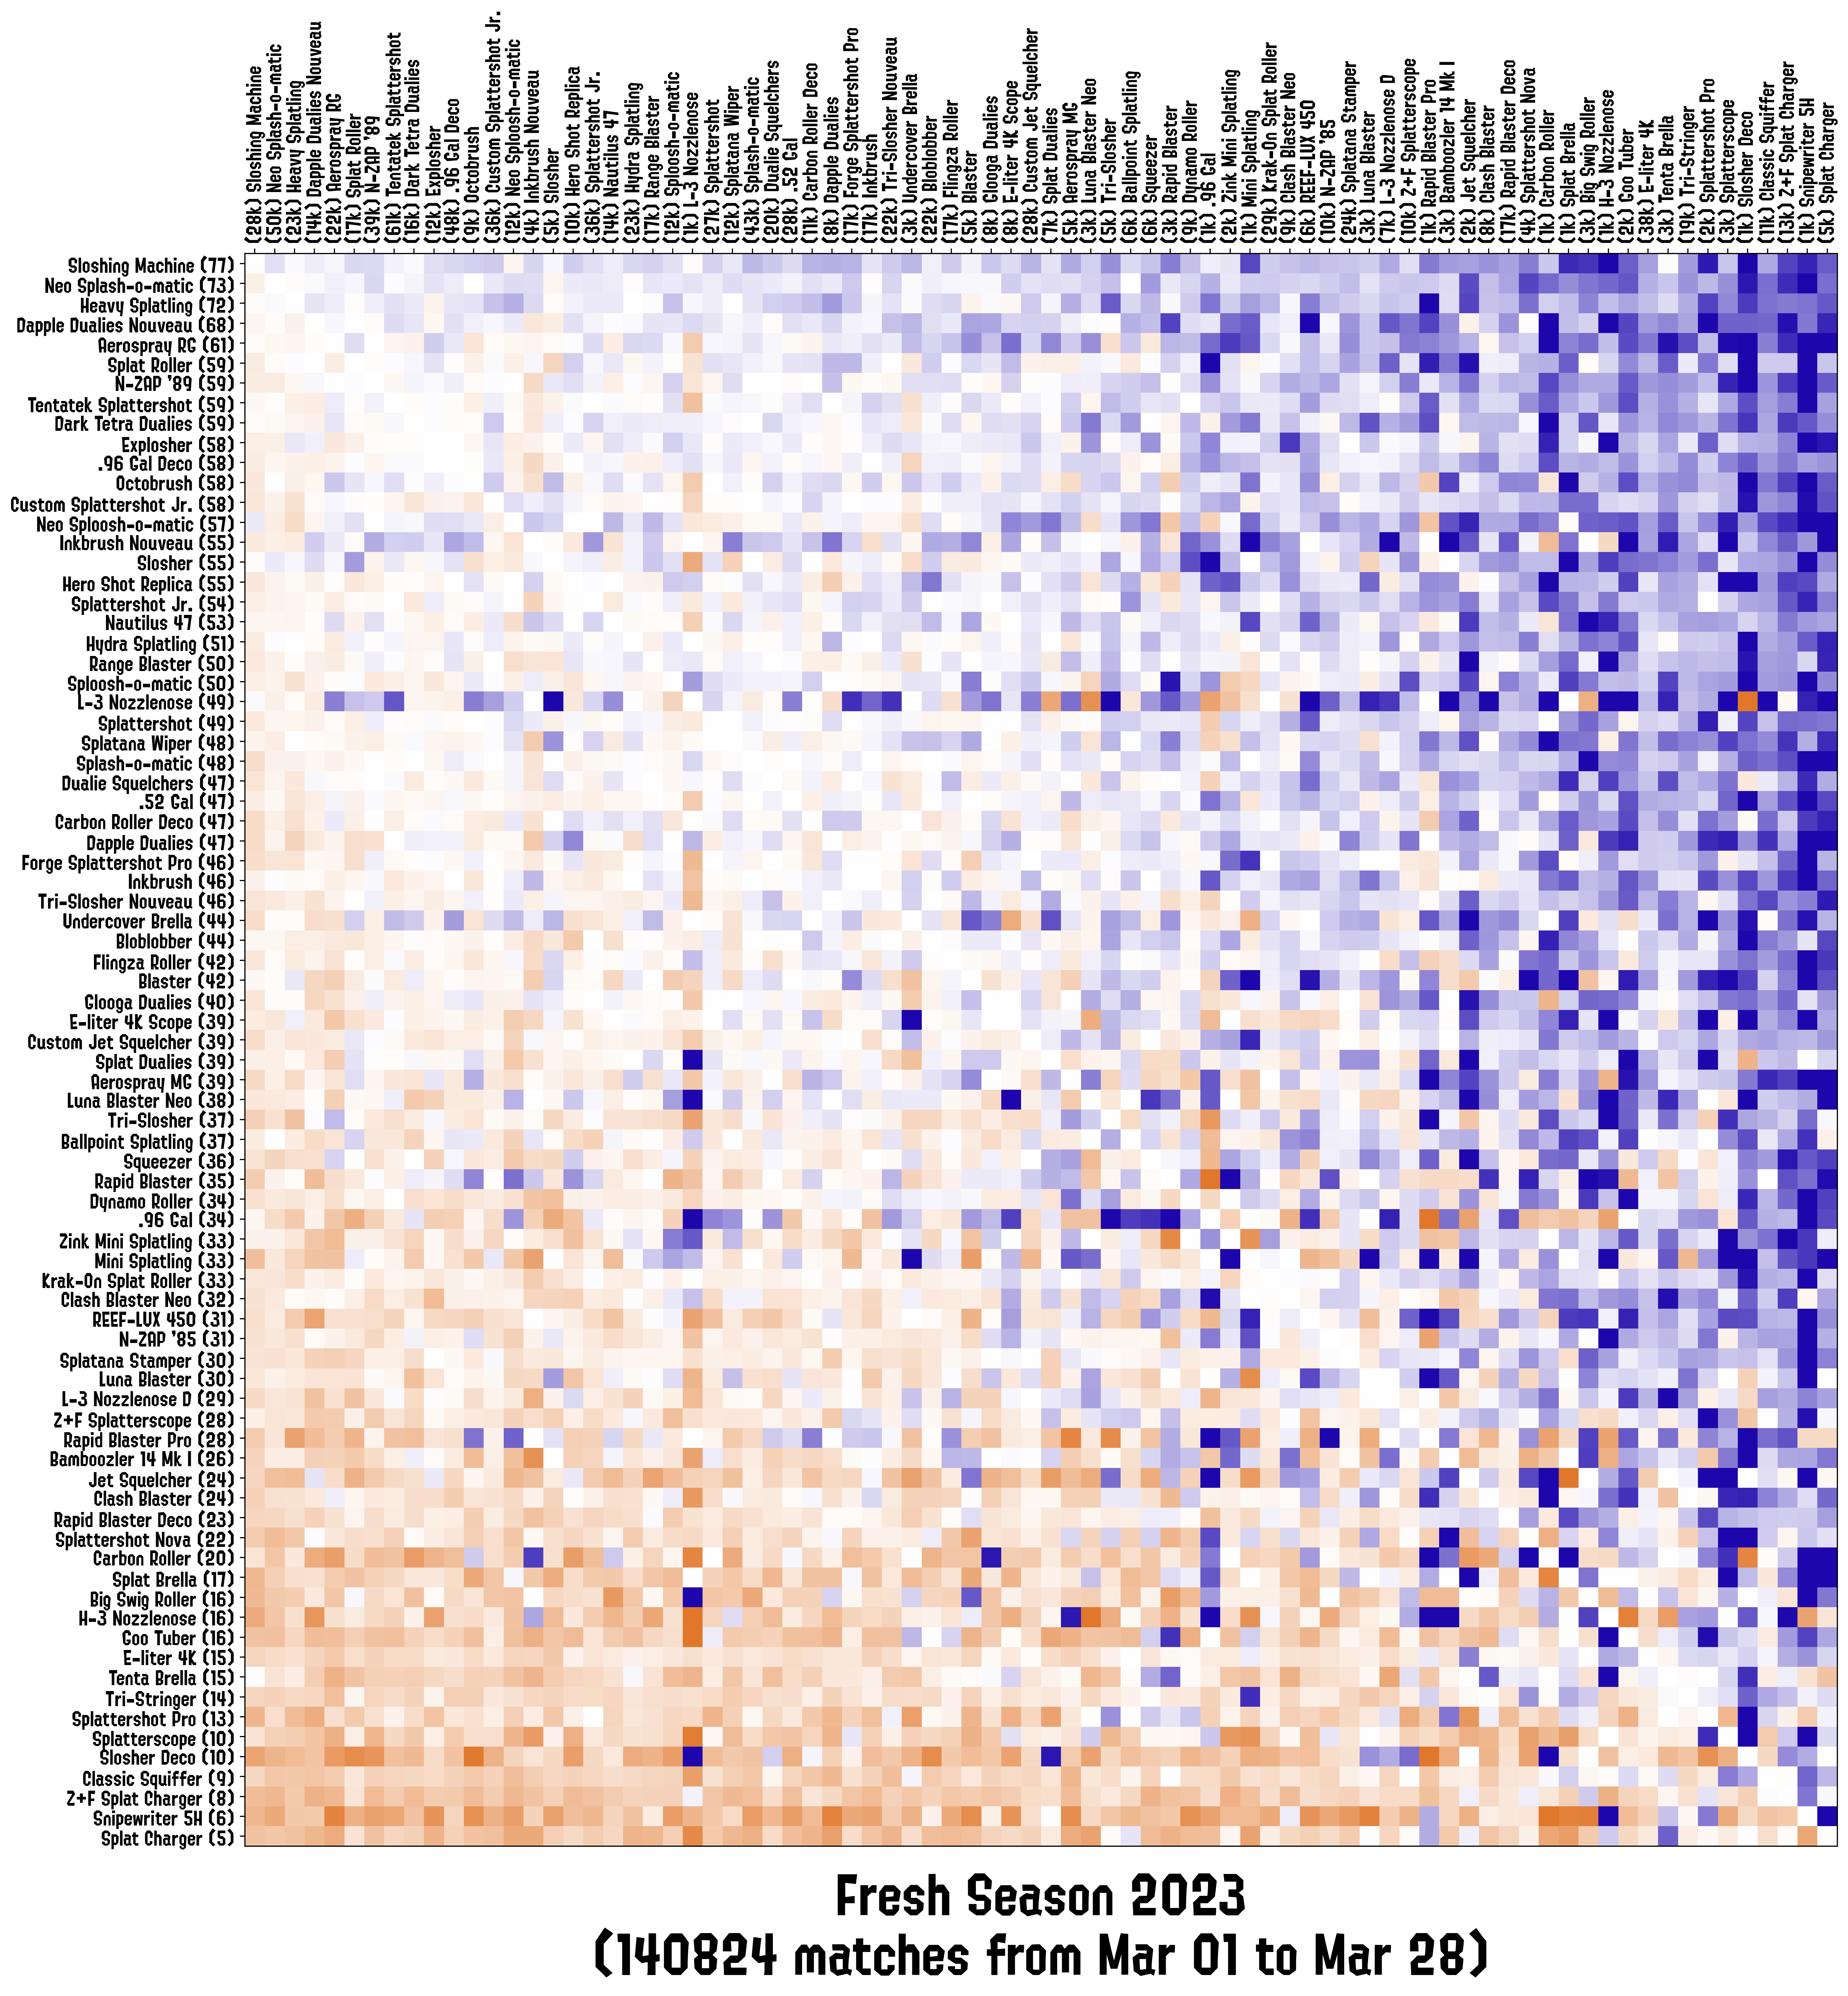
It should now be a bit more obvious why sorting the weapons by rank works for the visualization, as the weapons tend to decreace in dominance nicely along the diagonal if there’s enough data for the numbers to stabilize:
Facts and Future Work
There’s some efficiency updates that can take place in the matrix parsing function (vectorizing the matrix instead of iterating over the rows and columns), and in terms of quick facts:
- Unsurprisingly, the Sloshing Machine and Splash-o-matic dominated the first season.
- Splash-o-matic did show a small dip in ranking in the second season, which could be due to more players picking it up but not being that proficient with it (as the weapon itself has received no buffs or nerfs).
- The Aerospray RG has seen a lot of good use in the Chill season, which could correlate with the fact that a lot of players have been playing “Splat Zones” more often than the other game modes.
- There’s a small “anomaly” with the L-3 Nozzlenose, as I’m not aware that it’s considered a good weapon overall but it’s quite up in the ranks. It might be the case that there’s a niche of really good players winning their matches with it (as the participation number is relatively low as compared to other weapons).
- Fresh season is still young but we can already see some new weapons climbing the ladder, such as the .96 Gal Deco and Neo Splash-o-matic!
Currently, the code is available but a bit messy, I still need to clean it up and to code the Docker image so that all the plots can be replicated quickly by anyone.
Code Repo
- Repository: Github Repo
- Dependencies: matplotlib, pandas, numpy, dill, termcolor, colorutils, tqdm, scipy, DateTimeRange, pywaffle, squarify