Coding several new plots with nicer style, and bundling the package through Docker.
Intro
In my previous post I laid out the general idea and code structure of a python package I’m putting together to analyze my Splatoon 3’s play data as scraped with the s3s python package. As a summary, I found out there was a community project that allowed to download matches data for personal analysis.

In this post, I’ll describe some of the plots updates, a small script to upload historic data to stat.ink, and the docker image packaging to automate the analysis of personal data!
Package Updates
This period has been quite exciting in terms of updates. With all the core structures defined I could spend more time doing some interesting plots to compare and analyze players’ stats, improving aesthetics, and automating data processing further.
Plots
All plots were updated for style. Colors were updated to be more saturated to keep in line with Splatoon’s personality. Additionally, Splatfont-2, was updated to make use of it (if available). I don’t hold the rights to ship this font, so it has to be downloaded from its source and can be loaded with:
splat.setSplatoonFont(FONT_PATH, fontName="Splatfont 2")
These two changes were exciting, ‘cause they improved the attractiveness of the visuals substantially but they were far from the only ones. Several new plots were coded up.
Game-Mode Stats
These barcharts condense a lot of information into a single panel. In general, they show the performance breakdown of a player on a given statistic across match-types and stages. For example, the next panel shows these breakdowns upon the player’s win ratio:
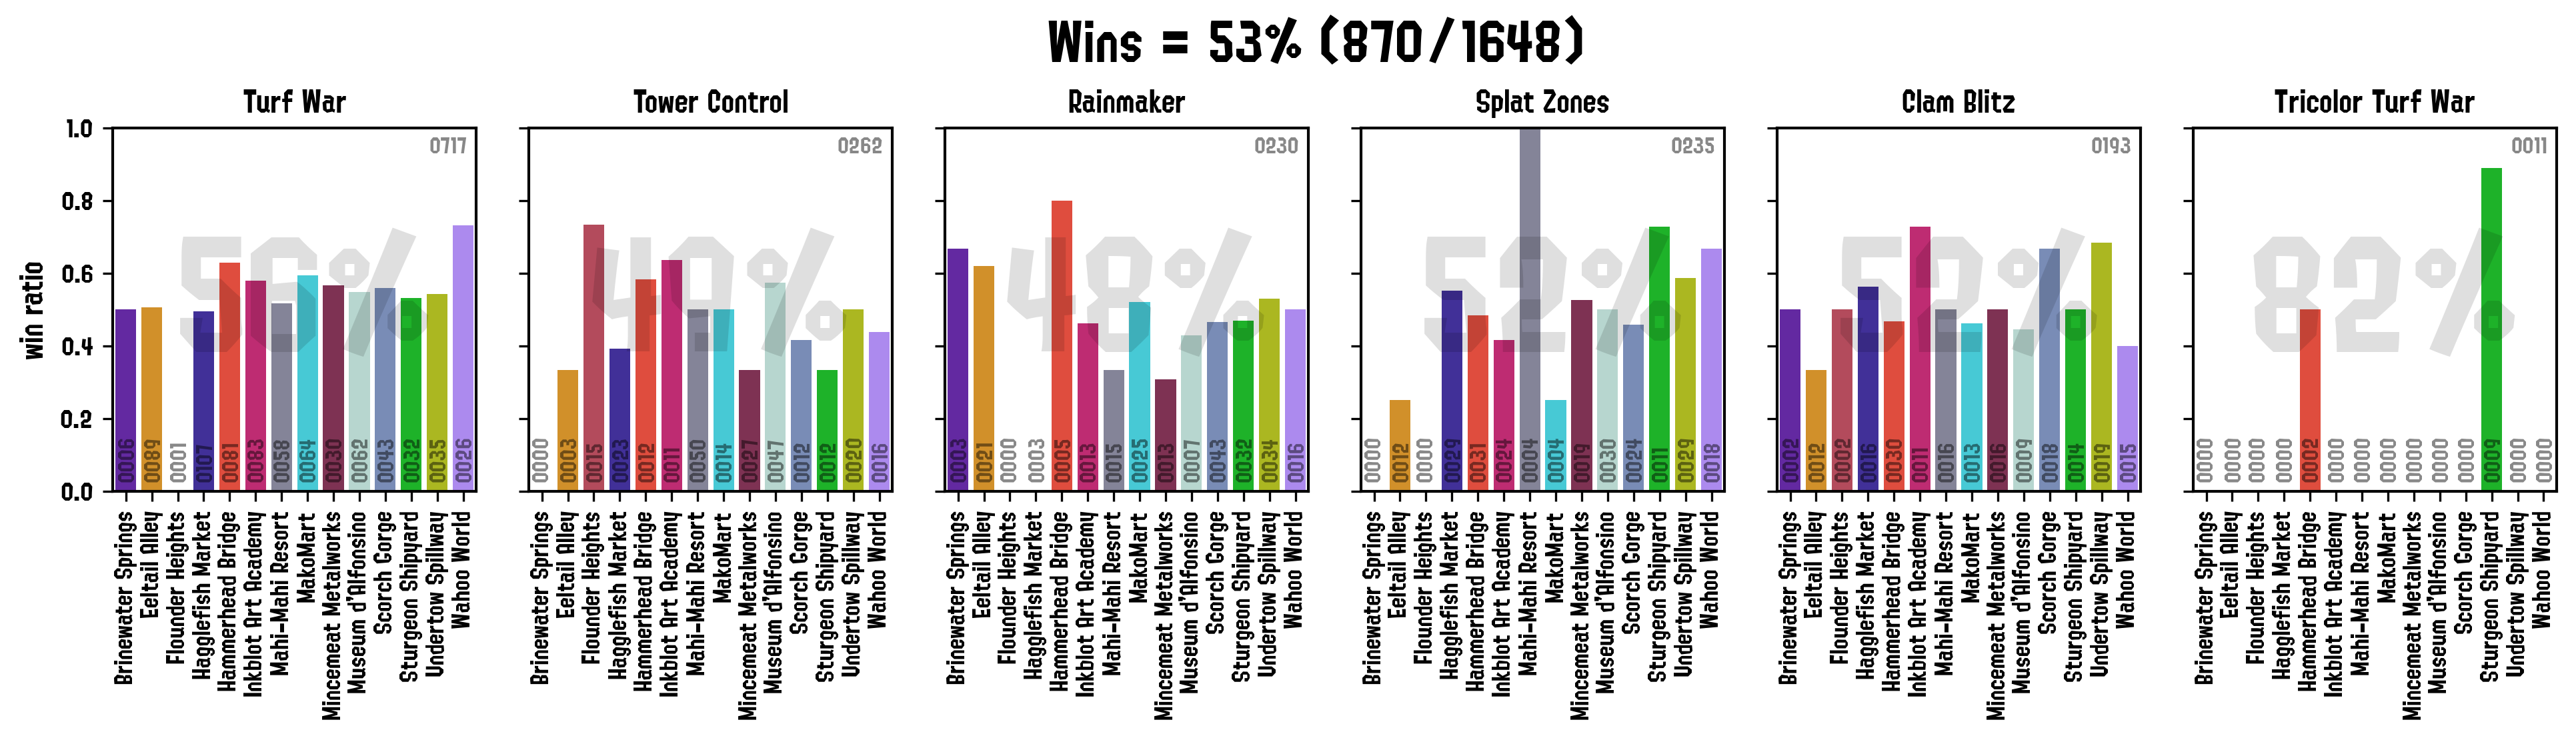
Where the large number on the background of the panel shows the aggregate win percentage, the number on the top corner shows the total number of matches, and the numbers on the bars display the number of matches played in any given stage. Similarly, the following panel breaks down information on the player’s kill ratio:
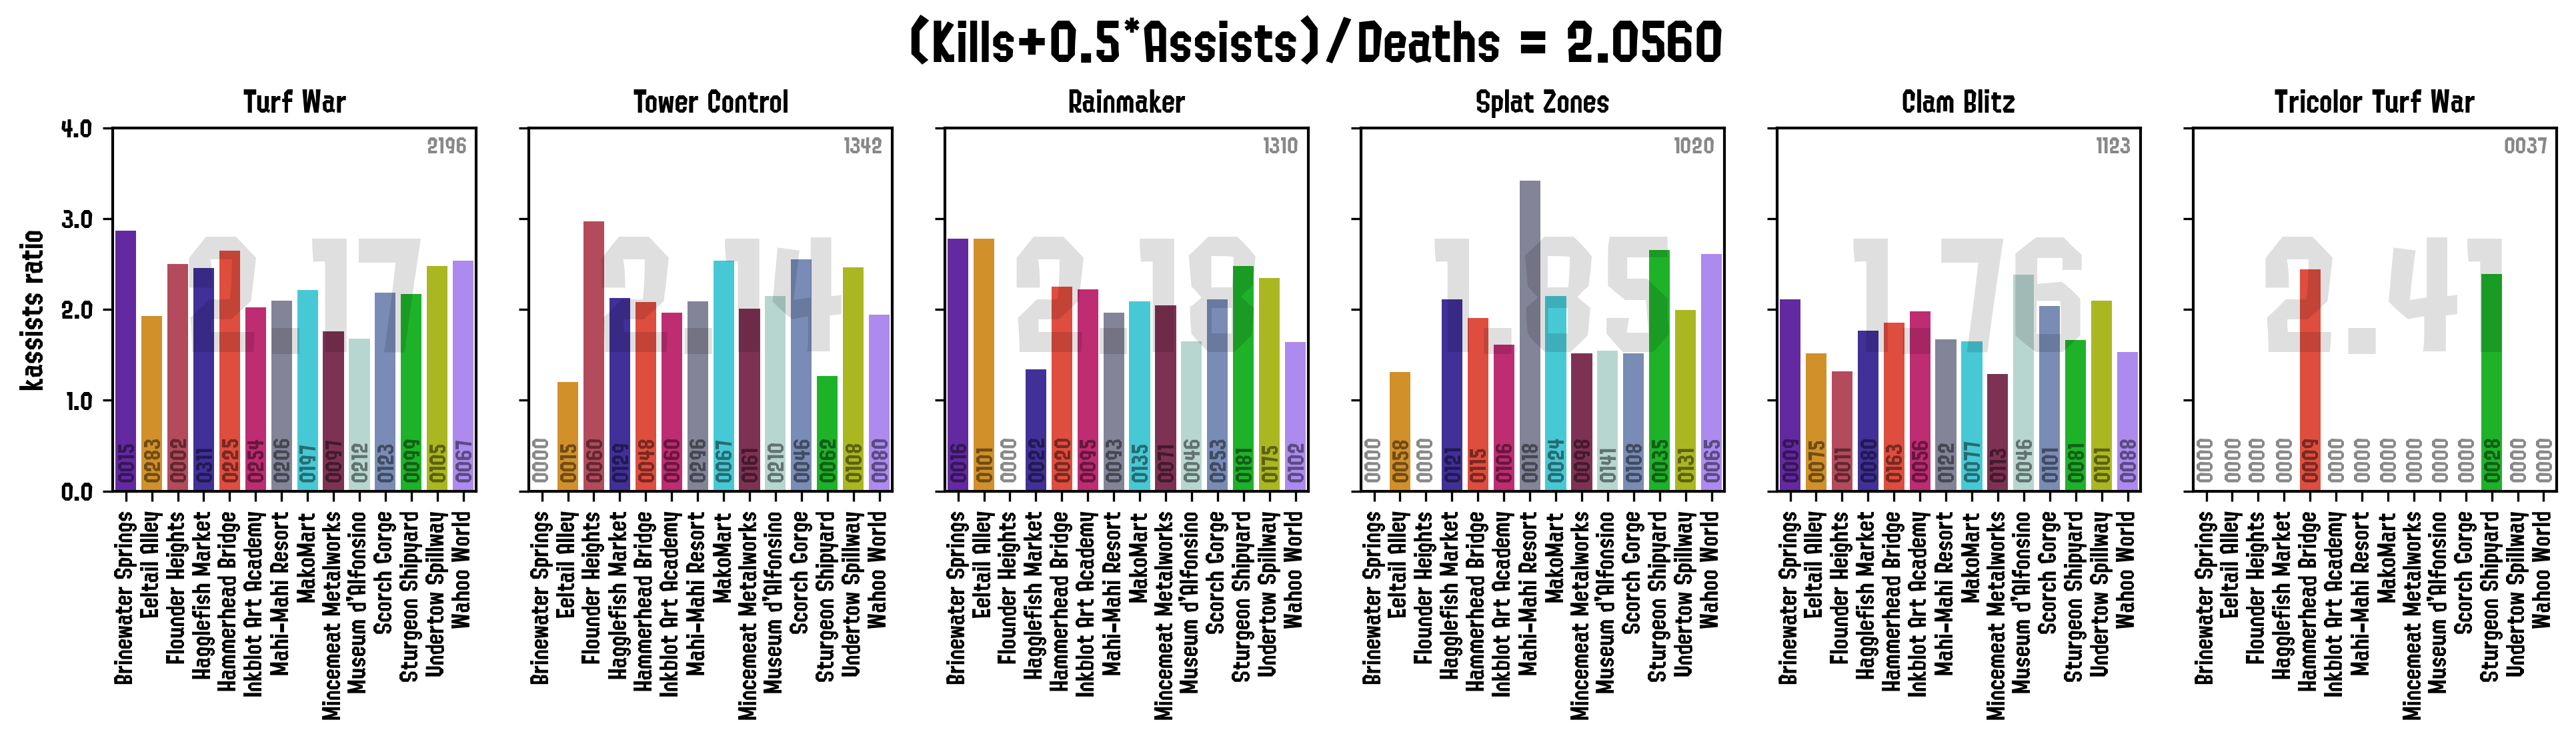
The main difference here being that information is shown as rates, instead of percentages.
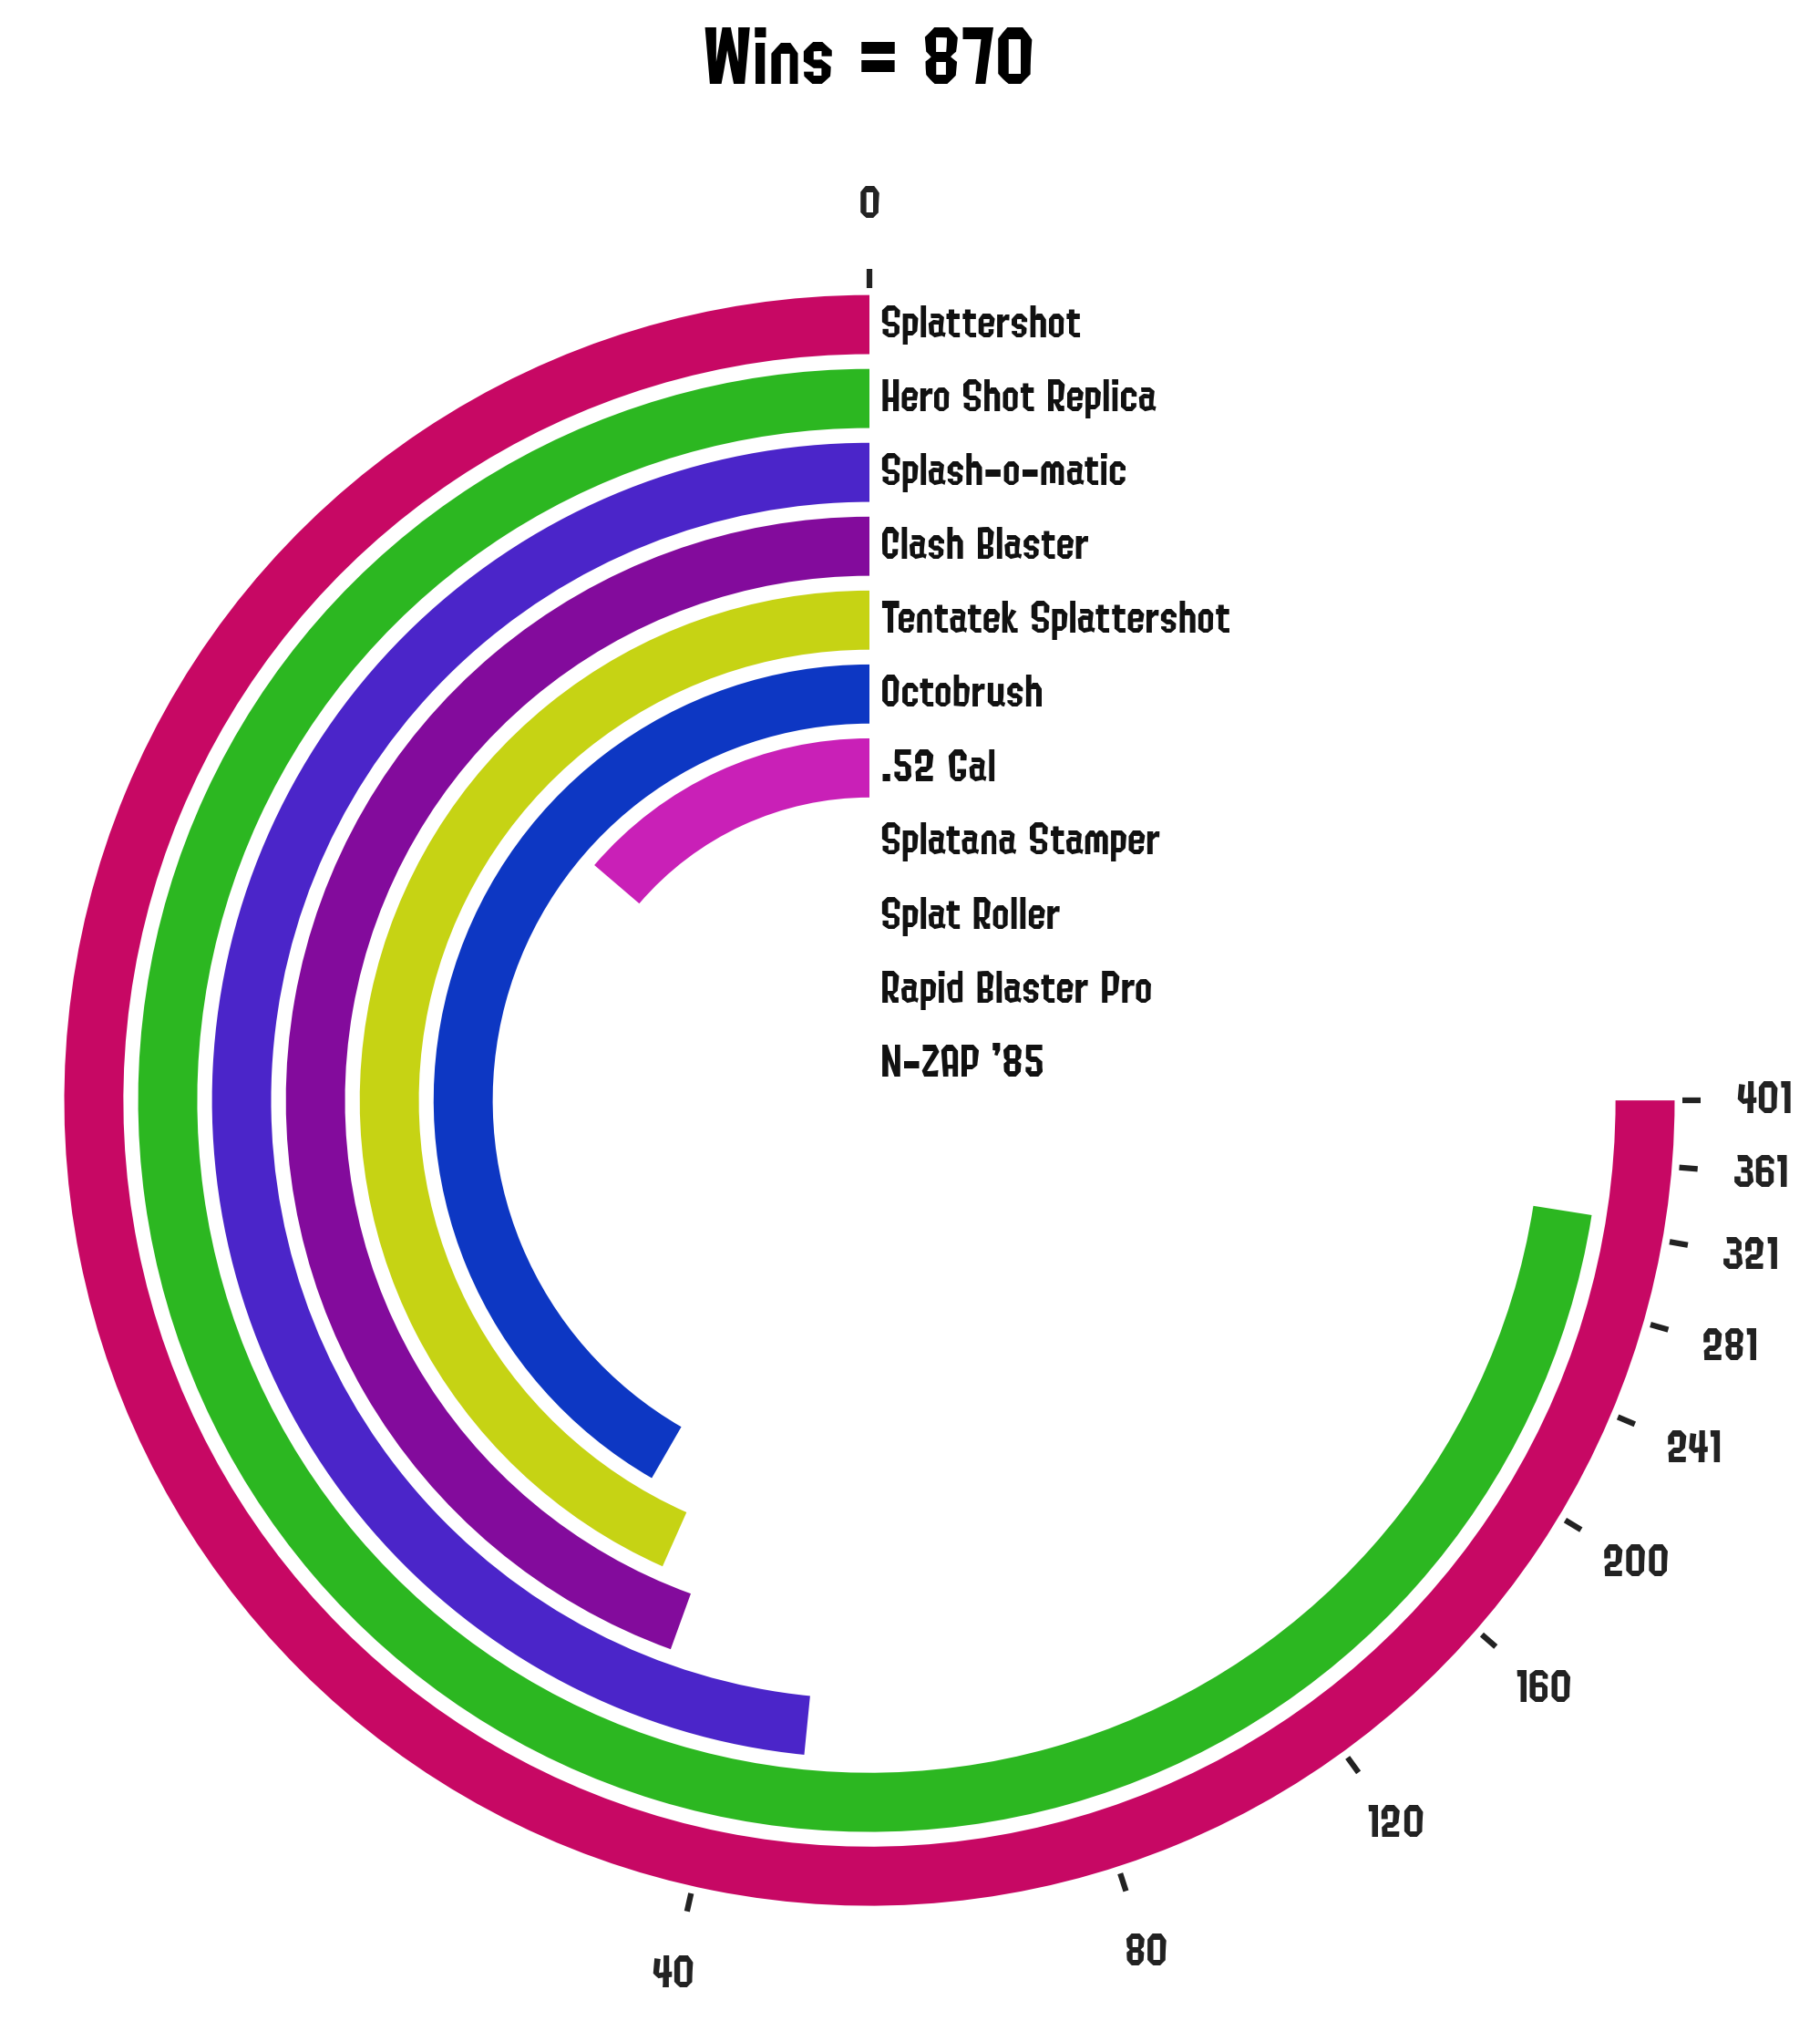
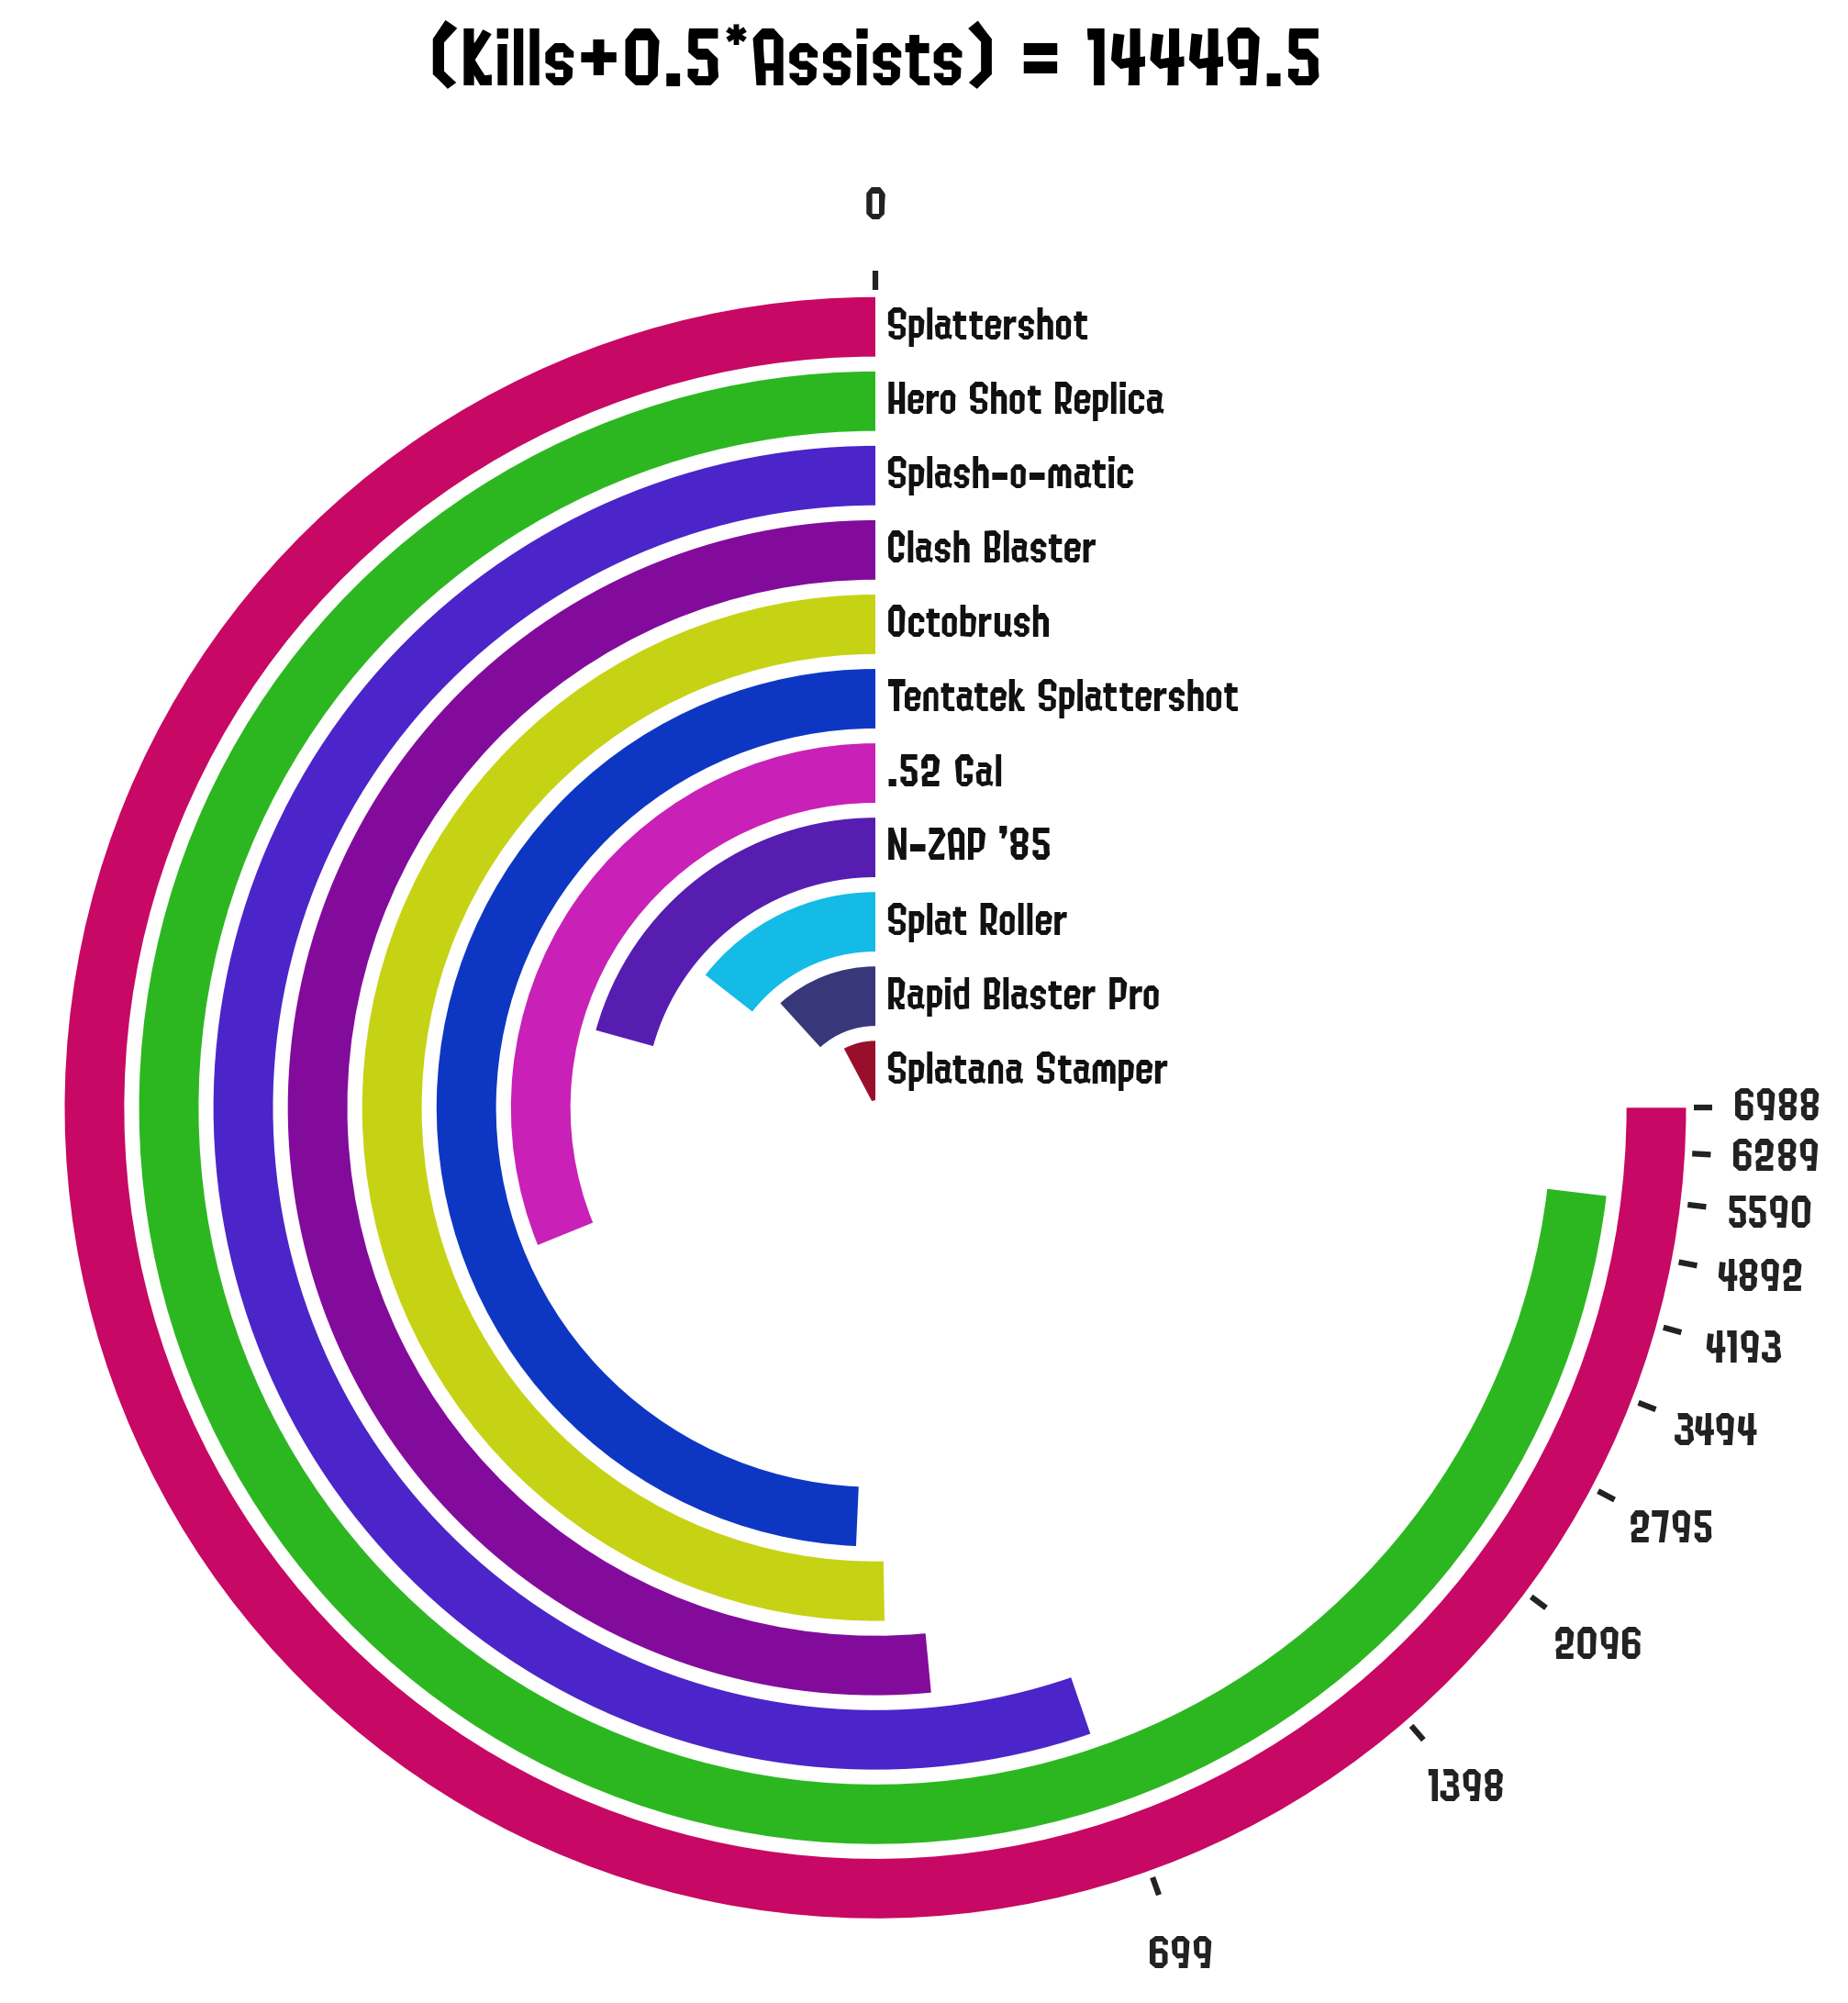
Polar Weapon
Traditional barcharts are a bit boring sometimes, so I went on and took some ideas from radial barcharts. First off, we can sort the weapons by whatever metric we are going to visualize (wins or kills, in this case). Then, we map the frequencies to angles using an interpolation function, and from that point we simply add some style so that the labels and ticks appear in the right locations:
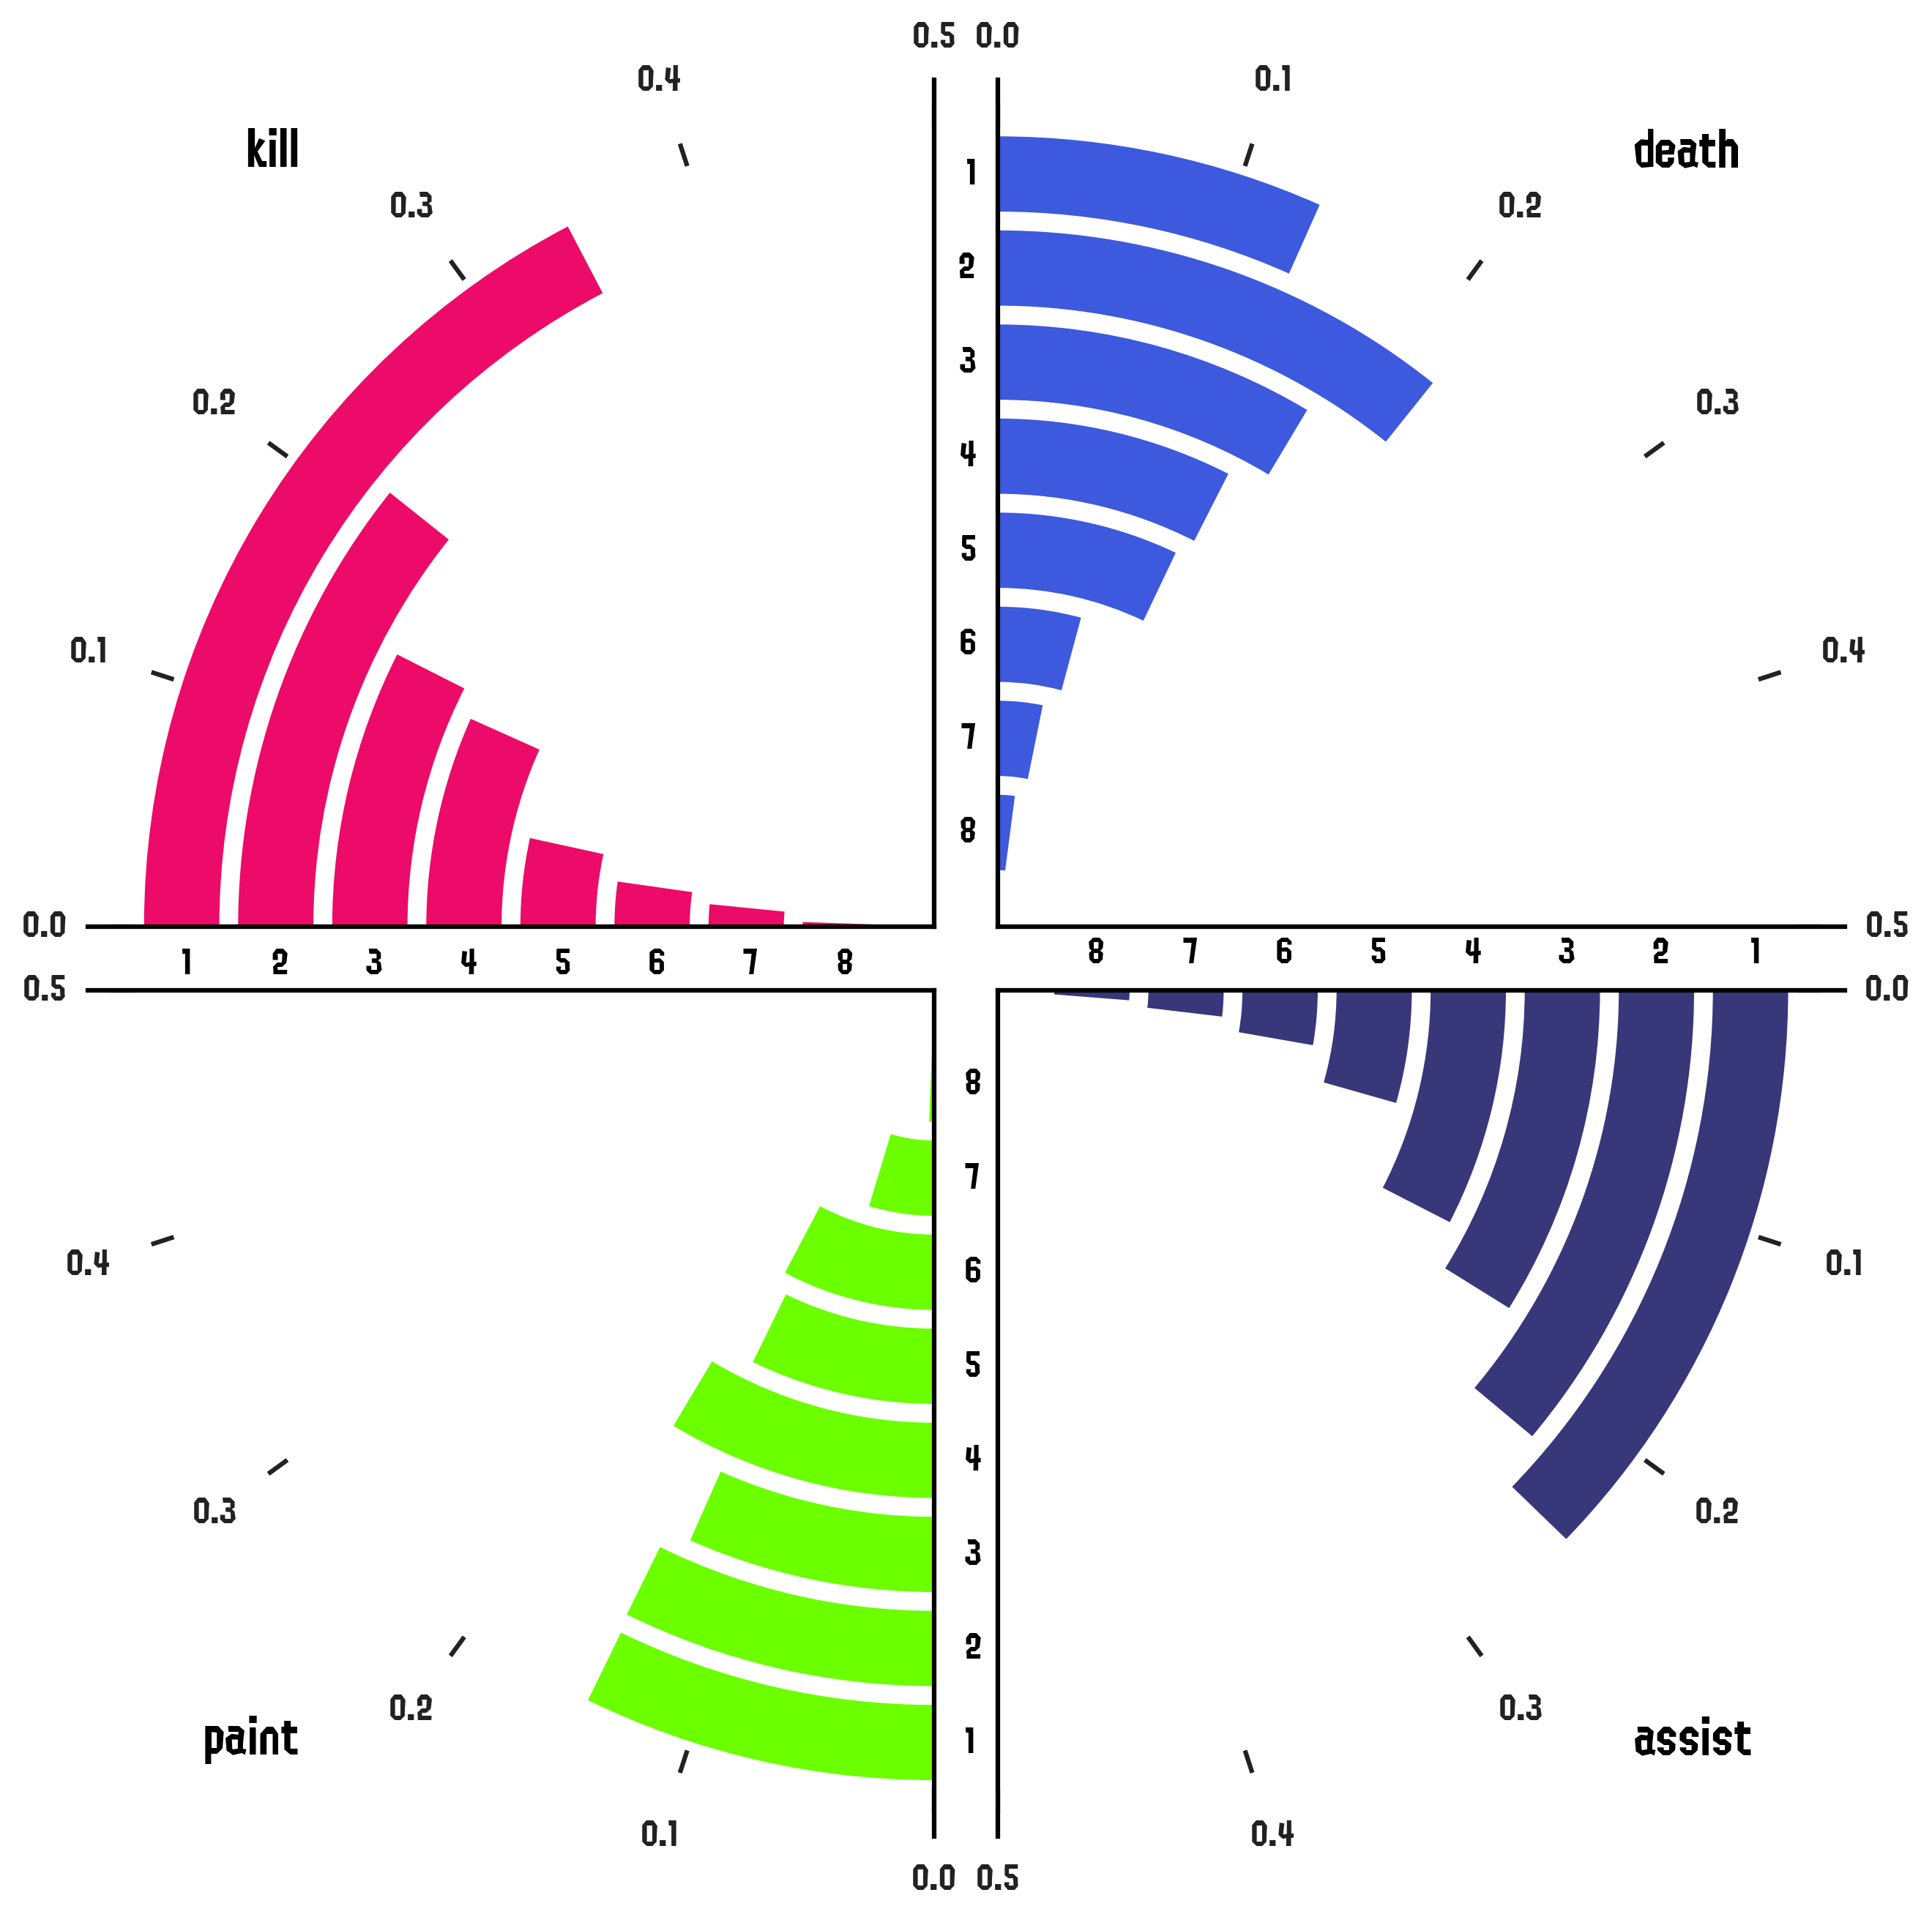
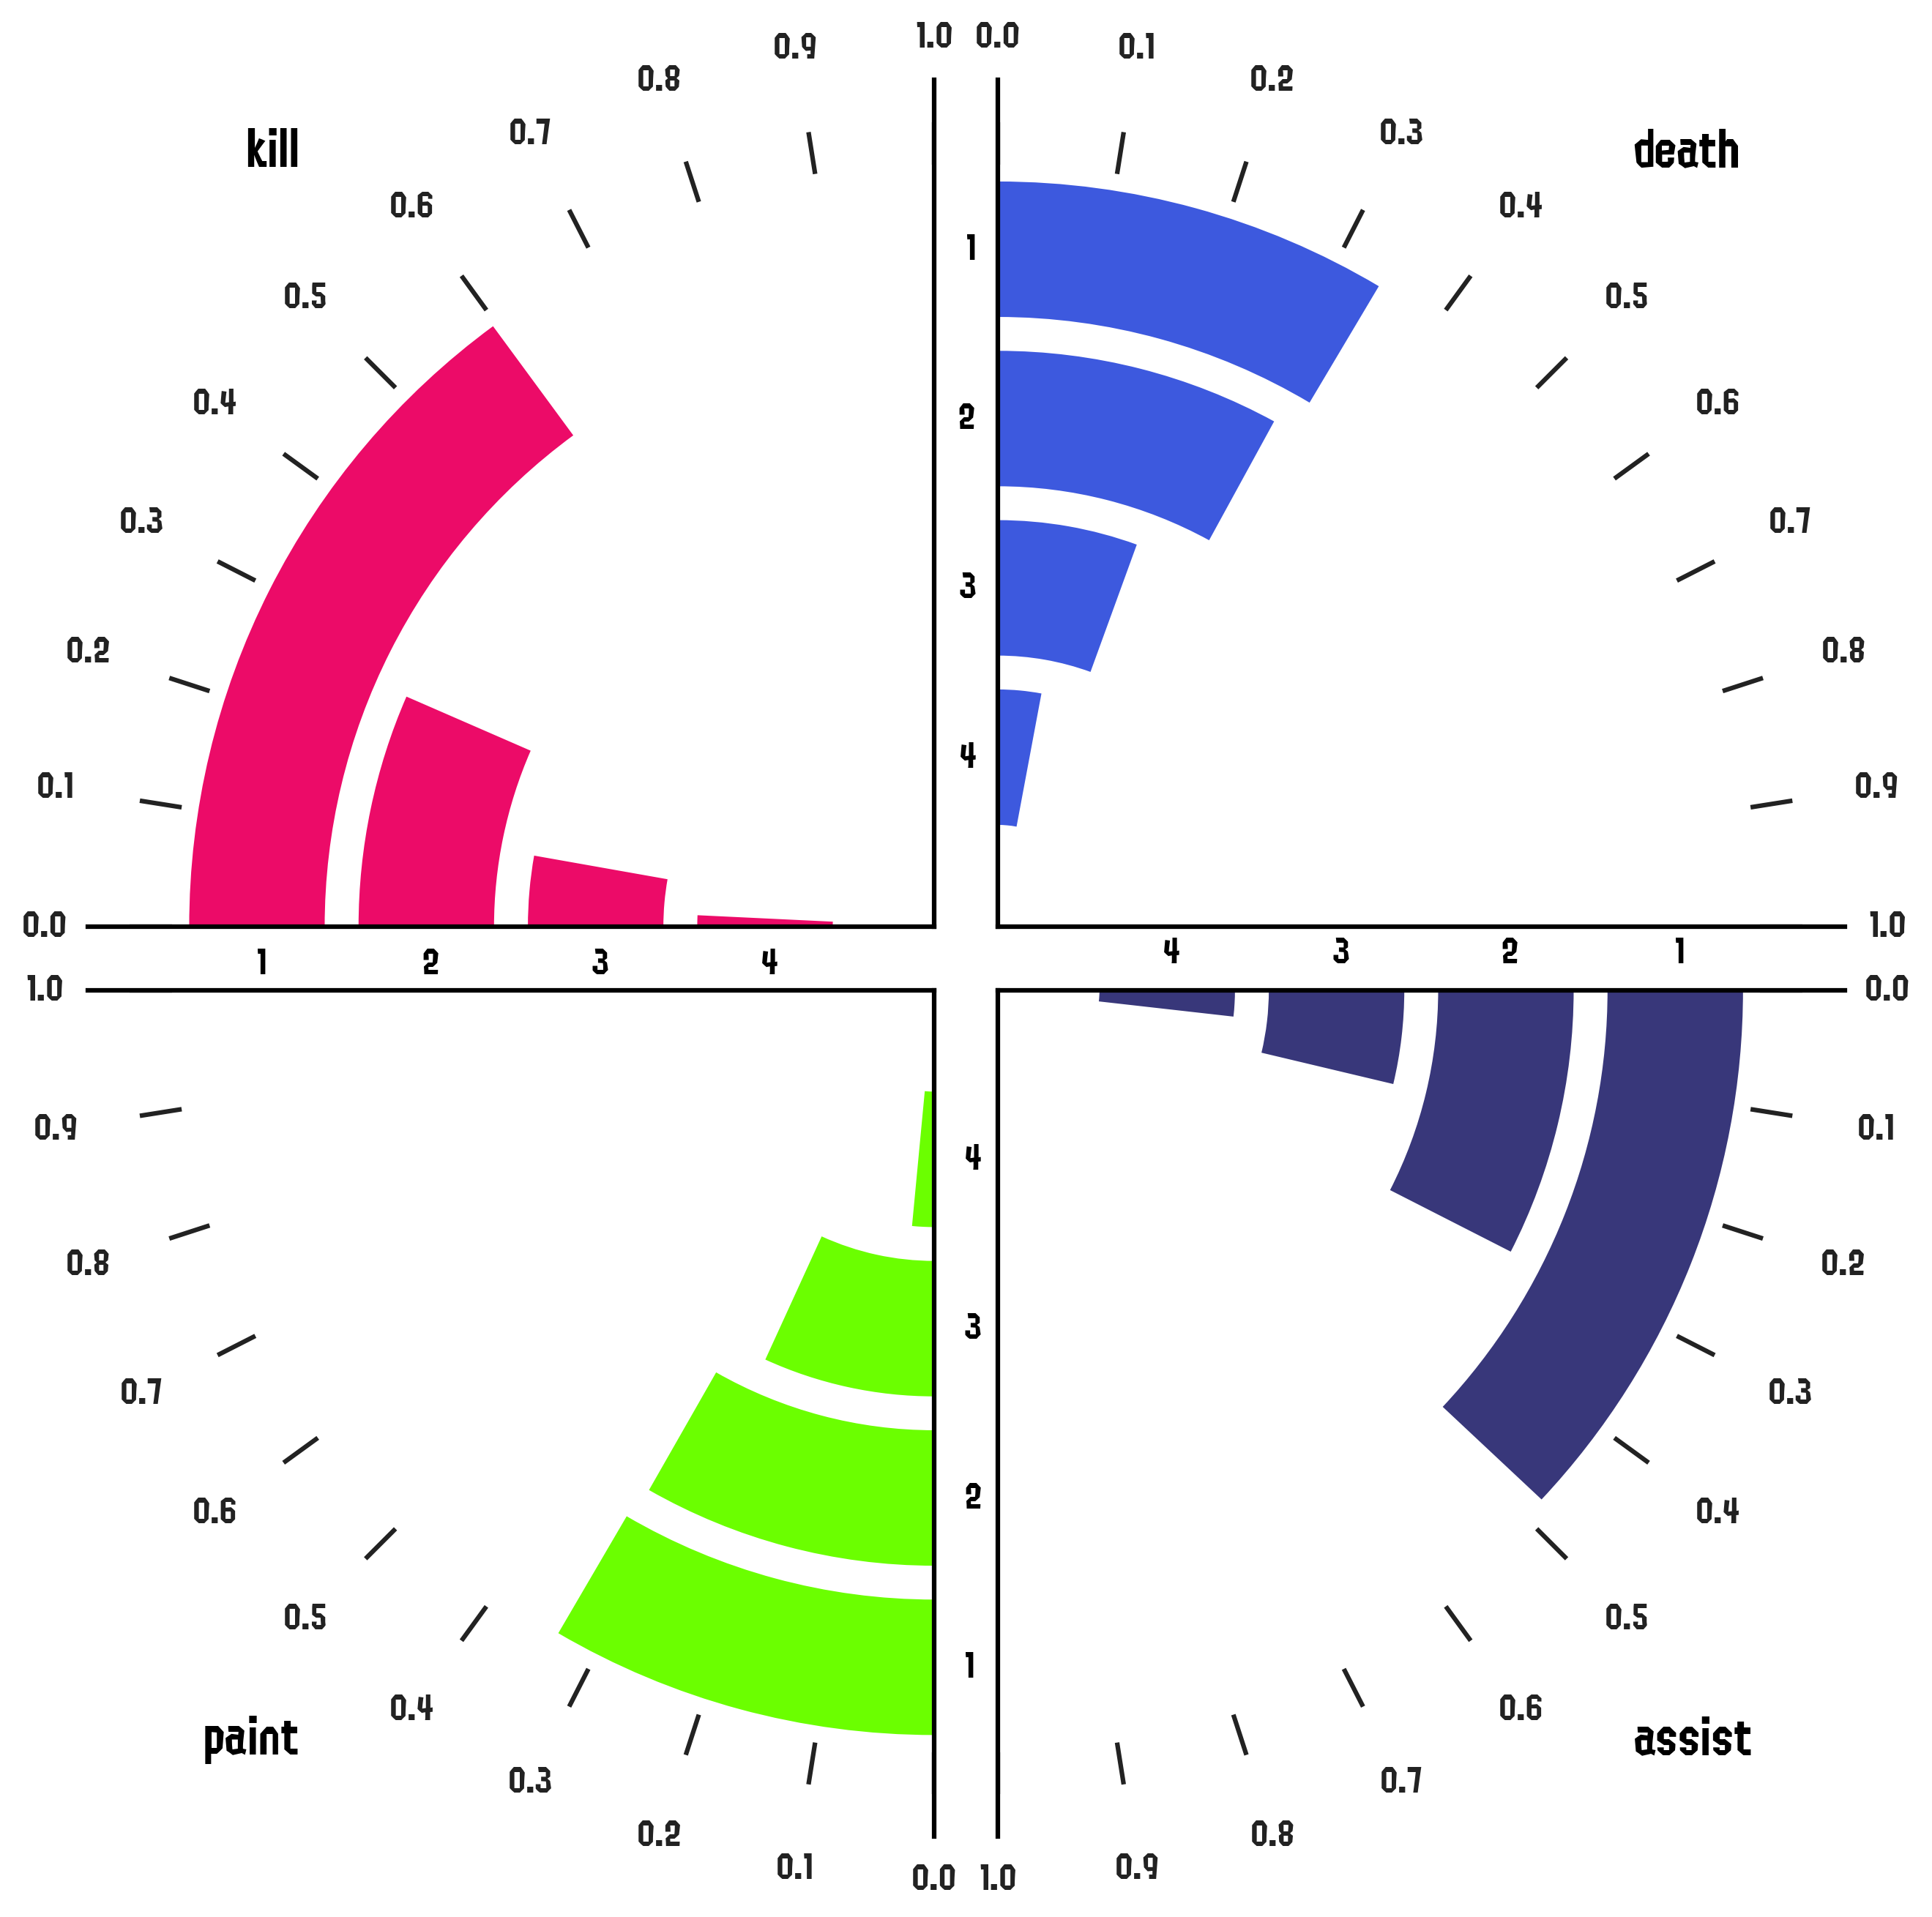
Polar Ranks
Originally, the data on how many times the player ranked in a certain spot given a match statistic was shown in an old-fashioned bar chart, but after doing the polar charts for weapons stats I decided to get a bit more creative with these visualizations. To do this, I generated a four-quadrant panel where each section shows the histogram of the player relative to the whole players set (allies and enemies), and only with relation to its allies:
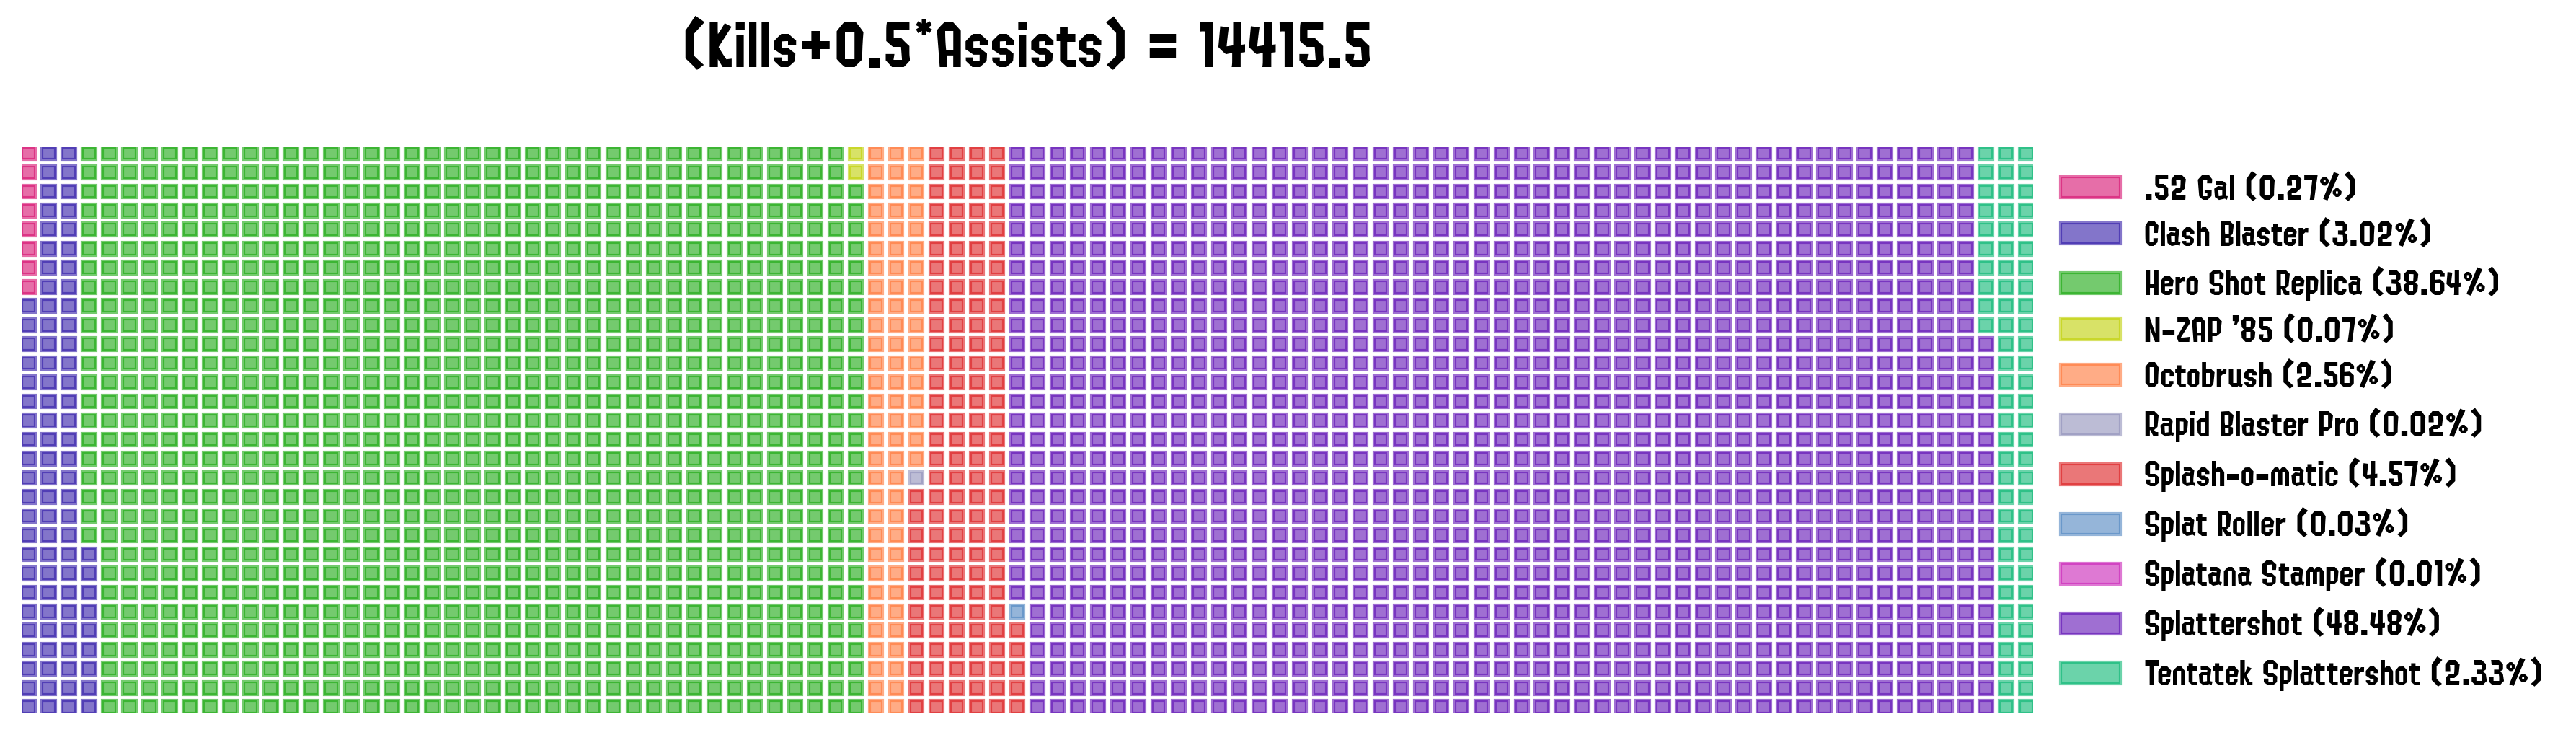
Waffle Plots
Another representation of proportions of a whole which can be calculated on a number of statistics and broken down by different categories. In this example, we breakdown the kills by weapon:
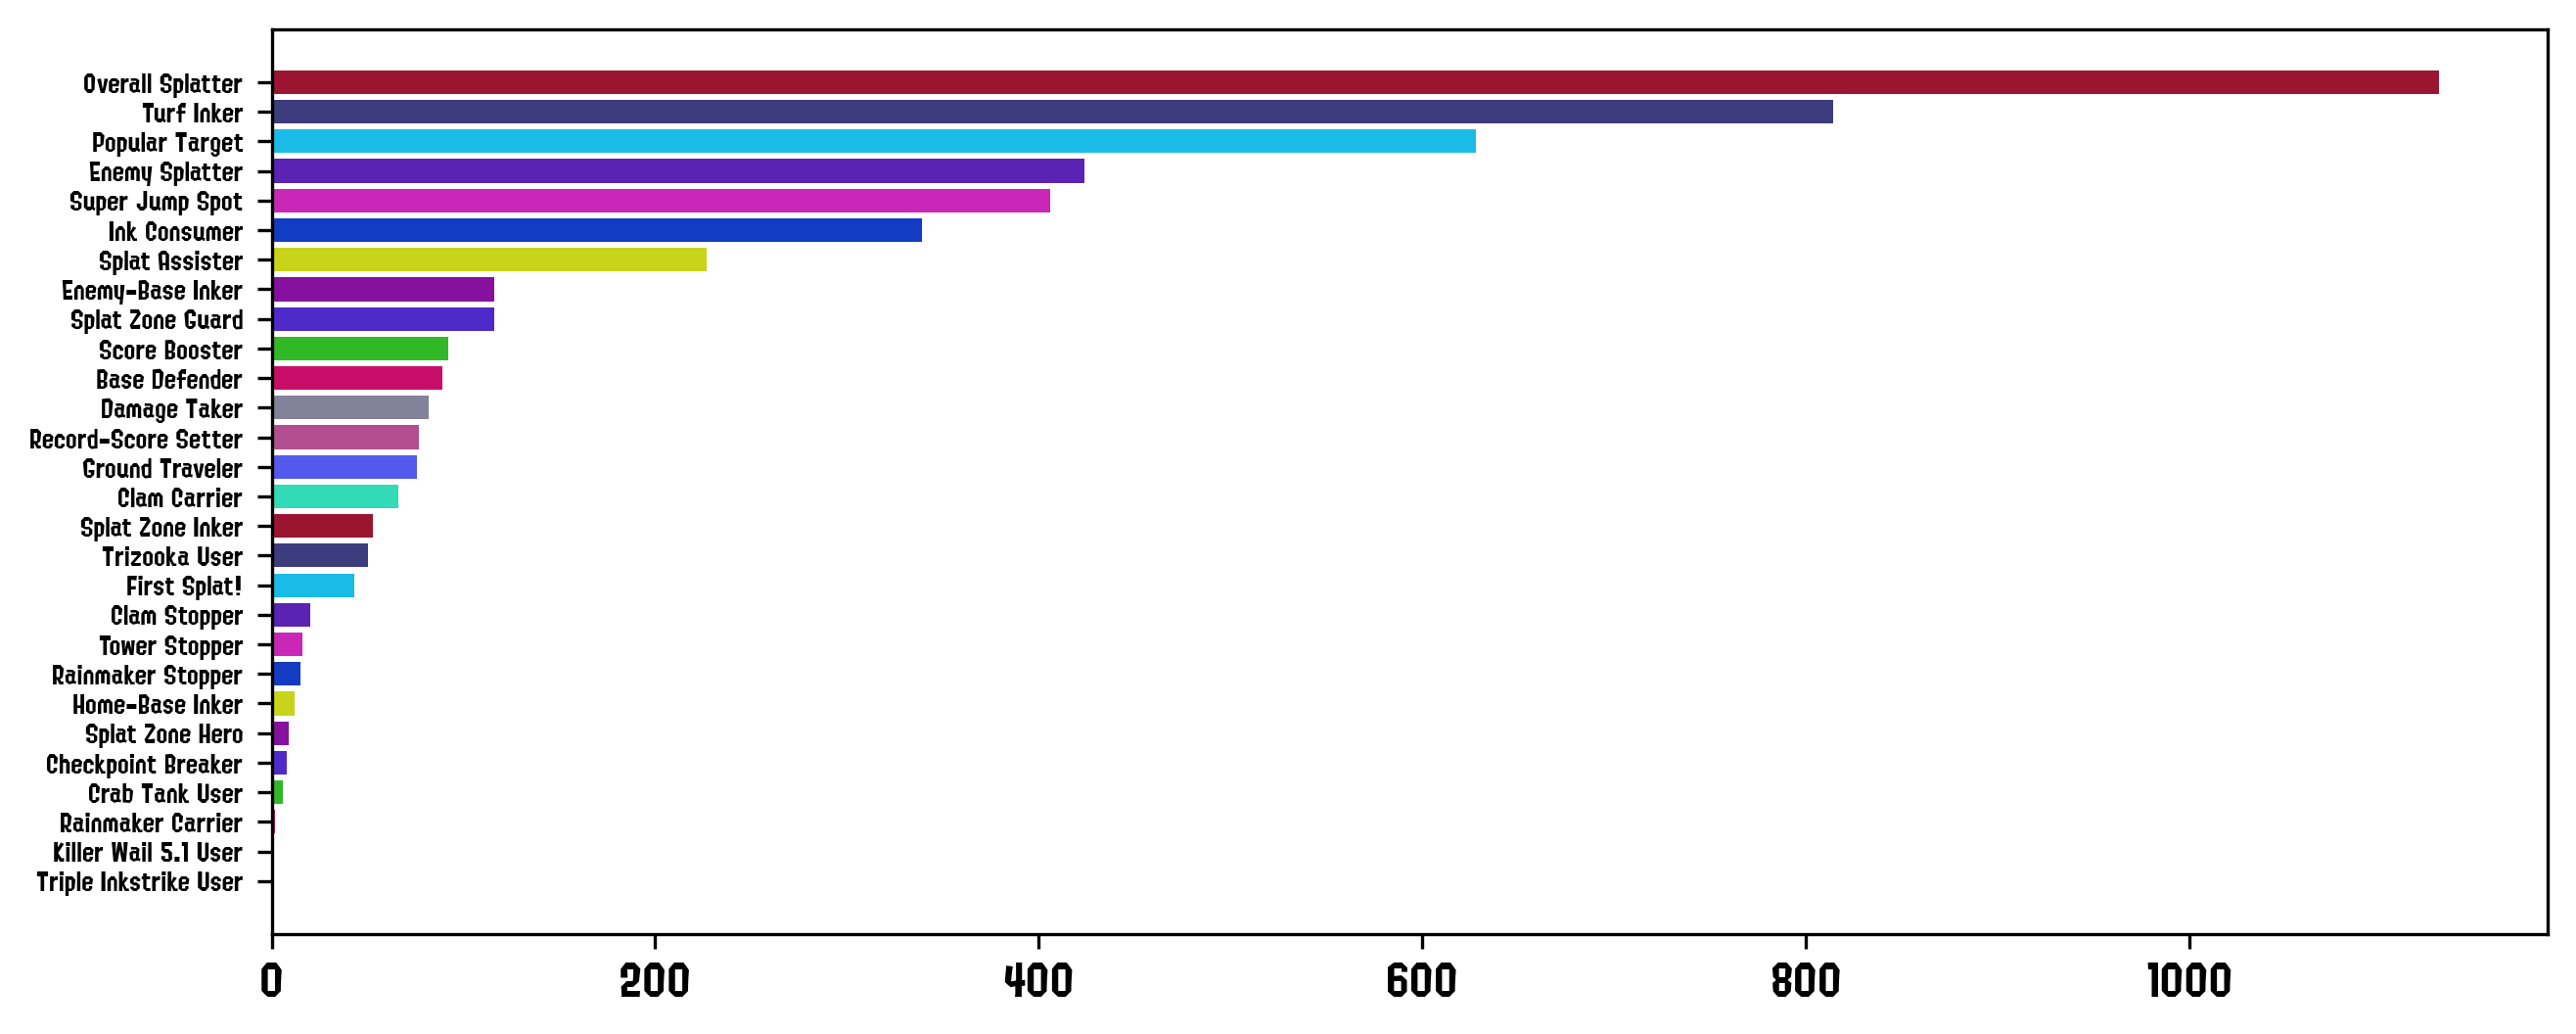
Awards
Finally, a simple barchart showing the frequency of awards given to the player:
Historics stat.ink Uploader
Recently, stat.ink added full support to Splatoon’s 3 data. Fortunately, I had all my historic JSON files and s3s has the options to upload previous battles to a personal profile. To do this, I coded this small bash script and let it run overnight:
fldrs = glob('./export*')
for fldr in fldrs:
    (r, o, s) = [path.join(fldr, i+'.json') for i in ('results', 'overview', 'coop_results.json')]
    print(f"python s3s.py -i {r} {o}")
    os.system(f"python s3s.py -i {r} {o}")
After this, my stat.ink profile was successfully updated with all my stored data going back to around a week after the game came out!
Docker Image
One of the main drawbacks of SplatStats as it stood up to now was that it needed the independent installation and handling of the s3s package. The following updates described here were done to make some progress in alleviating this nuissance by bundling both packages together (as s3s’ license does allow it as long as proper citing takes place).
Dockerfile
I’m far from an expert in docker, so I’m taking small steps to get the idea running and improving upon them slowly. In this initial work I’ve created this small dockerfile that installs all the required dependencies, creates folders and copies required data both from my SplatStats repo, and from s3s’ source code into the same image:
FROM python:3.10-slim-buster
# Install Linux, SplatStats and Make Folders ----------------------------------
RUN apt-get update \
    && python -m pip install --upgrade pip \
    && pip install beautifulsoup4 msgpack_python packaging Pillow requests \
    && mkdir SplatStats \
    && mkdir other \
    && mkdir data
# Copy needed files -----------------------------------------------------------
COPY ./ ./SplatStats
COPY ./other ./other
# Install SplatStats ----------------------------------------------------------
RUN pip install SplatStats/.
# Run -------------------------------------------------------------------------
ENTRYPOINT ["/bin/bash", "./SplatStats/SplatStats/dockerRoutines/dockerMain.sh"]
Where the entrypoint script, by default, downloads the most current data to the directory where the script is run, generates standard plots, exports the player’s history CSV file, and uploads the latest data to stat.ink.
The one minor caveat I still need to improve upon is that the current setup requires s3s’s config.txt file to be generated from s3s itself, so it still needs the aforementioned codebase to be downloaded and run at least once, which I’m working on fixing in later releases.
Use Example
To download the image, we can run:
docker pull chipdelmal/splatstats
Once it has finished, we need to run s3s at least once, and to setup the following folder structure (the battles and out folders are auto-created, but the jsons one has to be created manually for now):
data
  jsons
    config.txt
  battles
  out
With this in place, we are ready to do some data download and processing! The following lines run the main analysis routines:
docker run \
  --net=host \
  --user "$(id -u):$(id -g)" \
  -v "$(pwd)":/data/ \
  splatstats:dev \
  --player "čħîþ ウナギ" --download True --upload True --overwrite True --weapon All
These lines setup network access (needed by s3s), pass the user ID to the image (to avoid permission issues with generated files), create a volume to dump the data and result files in, and run the scripts to download, upload and process the whole dataset.
Auto-Team Script
One of the advantages of using SplatStats is that it can not only analyze your personal data, but the data of players who are present in your matches too. In my case, I wanted to automate the analysis of the data of all the friends I play with for which I created a bash wrapper that looks as follows:
# Download my data and push to stat.ink ---------------------------------------
docker run \
  --net=host \
  --user "$(id -u):$(id -g)" \
  -v "$(pwd)":/data/ \
  splatstats:dev \
  --player "čħîþ ウナギ" --download True --upload True --overwrite "True"
# Process Team's data ---------------------------------------------------------
NAMES=(
  'Yami ウナギ' 'Riché ウナギ' 'April ウナギ' 'DantoNnoob'
  'Oswal ウナギ' 'Murazee' 'Rei ウナギ' 'HSR'
)
for idx in "${!NAMES[@]}"; do
  pName=${NAMES[$idx]}
  docker run \
    --net=host \
    --user "$(id -u):$(id -g)" \
    -v "$(pwd)":/data/ \
    splatstats:dev \
    --player "$pName" \
    --overwrite "False"
done
And assigned it to an alias in my .bashrc file, so that I can type a command in the terminal to run the whole thing!
For more information on how to run this Docker Image and the required folder structure, please have a look at the README (documentation coming soon).
Future Work
I plan to work a bit more in making the docker image a bit more streamlined (specially in the s3s credentials setup), as well as to start working a bit more on the team matchups analysis to understand better which teams compositions cause me the most trouble.
Code Repo
- Repository: Github Repo
- Docker: Docker Image
- Dependencies: matplotlib, pandas, numpy, dill, termcolor, colorutils, tqdm, scipy, DateTimeRange, pywaffle, squarify