Creating rank-plots on the “Mario Kart 8 Deluxe” speedruns leaderboard.
Intro
For a while now I’ve been wanting to create a “bump chart” on the MK8D leaderboards data. This, however, wasn’t as straightforward as I would have liked it to be. The leaderboard history is stored in the same webpage as “obsolete runs”, which makes it a bit tricky to parse with a simple scraper. Even worse, the HTML tags for the runs times are somewhat strange and not automation-friendly. This ended up being a web-scraping adventure even before the data-shaping and visualizing part started but the results were quite better than I expected.
Description
Scraping Leaderboard
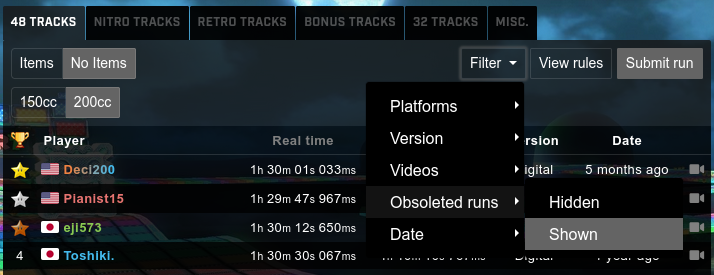
First thing to do was to scrape the leaderboard with all the obsolete runs. This is a bit cumbersome because it involves “clicking” a bunch of buttons. For example, to go to the “48 tracks, 200cc, No Items” we have to click 3 buttons, and then click an additional two and one highlight for the “Obsolete” runs to be shown. For all our scraping needs, we will be using Selenium.
To select the category, we define the objects’ XPaths:
tracks48 = {
  'trk': '//*[@id="category73495"]',
  'itm': {
    'Items': '//*[@id="varnav23164"]/label[1]',
    'NoItems': '//*[@id="varnav23164"]/label[2]'
  },
  'spd': {
    '150cc': '//*[@id="varnav11257"]/label[1]',
    '200cc': '//*[@id="varnav11257"]/label[2]'
  }
}
Now, with the dictionaries set for the categories, we can click all the buttons required to get to the leaderboard we want to analyze and wait some seconds to make sure everything gets updated correctly:
catDict = const.catSelector(TRK)
(trkBtn, spdBtn, itmBtn) = (
    driver.find_elements_by_xpath(catDict.get('trk'))[0],
    driver.find_elements_by_xpath(catDict.get('spd').get(SPD))[0],
    driver.find_elements_by_xpath(catDict.get('itm').get(ITM))[0]
)
trkBtn.click(); itmBtn.click(); spdBtn.click();
time.sleep(5)
Once we get the leaderboard showing up, it’s time to make the obsolete runs visible:
# Click filter button
fltr = '//*[@id="leaderboard-menu"]/div/div[2]/div[1]/button'
fltrBtn = driver.find_element_by_xpath(fltr)
fltrBtn.click()
# Hover on obsolete runs
obs = '//*[@id="leaderboard-menu"]/div/div[2]/div[1]/ul/li[4]/a'
obsBtn = driver.find_element_by_xpath(obs)
a.move_to_element(obsBtn).perform()
# Highlight show obsolete
shwn = '//*[@id="leaderboard-menu"]/div/div[2]/div[1]/ul/li[4]/ul/a[2]'
shwnBtn = driver.find_elements_by_xpath(shwn)[0]
shwnBtn.click()
time.sleep(15)
And now, we are finally ready to scrape the runs’ data. To do this, we are going to go row by row and get the link to which it points, so that we can open each run’s page and scrape the timing data:
xPath = '//*[@id="primary-leaderboard"]/tbody/tr[{}]'
runLinks = []
for row in range(1, MAX_ROWS):
    try:
        r = xPath.format(row)
        rObj = driver.find_element_by_xpath(r)
        runLink = rObj.get_attribute('data-target')
        runLinks.append(BASE_URL+runLink)
    except NoSuchElementException:
        break
driver.quit()
Which gives us a table like this one (which we store in a CSV file):
https://www.speedrun.com/mk8dx/run/z0o7nejz
https://www.speedrun.com/mk8dx/run/y47r59ny
https://www.speedrun.com/mk8dx/run/zq177w5m
...
https://www.speedrun.com/mk8dx/run/yd9qr00z
https://www.speedrun.com/mk8dx/run/ywd1pwnz
https://www.speedrun.com/mk8dx/run/mr8p87dy
The code for this section is available at this link.
Scraping Runs
With our links file ready, we move towards downloading the data from each run. This involves opening every one of the links we just stored in our CSV file to get: Runner's Name, Run Time, Run's Date, Submission Date.

Unfortunately not all of the data from each run is formatted the same, so it takes a bit of cleaning to get the actual name of the runner (which I’m omitting ‘cause they are not particularly interesting):
entriesList = []
for i in range(0, entriesNum):
    # Get page
    driver.get(df.iloc[i]['Link'])
    # Get sumbision dates
    (submT, dateT) = (
        driver.find_element_by_xpath(submX).text,
        driver.find_element_by_xpath(dateX).text
    )
    # Get submission time
    head = driver.find_element_by_xpath(runtX).text
    headSplit = head.split('-')
    (cat, time) = (headSplit[0], headSplit[1])
    ###########################################################################
    # OMITTED LINES FOR CLEANING THE RUNNER'S NAME
    ###########################################################################
    authT = authT.split('(Obsolete)')[0].strip()
    # Assemble result
    row = (str(authT), runtT, dateT, submT)
    entriesList.append(row)
And we end up with a CSV file that looks like this:
Runner,Time,Date,Submitted
TechnicalJL,1h 25m 10s 808ms,2022-01-11,2022-01-11
Pianist15,1h 24m 48s 867ms,2021-08-03,2021-08-26
mkalpha,1h 24m 30s 733ms,2021-05-26,2021-05-26
...
GoomBayPacker,1h 51m 07s,2021-01-13,2021-01-14
Zachariah420,1h 52m 32s,2017-12-26,2018-10-04
Leo179,1h 55m 49s,2018-05-20,2018-05-20
Joltkip,2h 37m 29s,2020-07-02,2020-07-02
To look into detail at the code for this section follow this link.
Reshaping Data
Fortunately, at this point we are done with scraping data! Now, we need to reshape our dataset so that we are able to plot the data. The first step after reading our CSV file is to process our columns to make them dates, and times:
df['Runner'] = [str(i) for i in df['Runner']]
df['Date'] =  pd.to_datetime(df['Date'], format='%Y-%m-%d').dt.date
df['Submitted in'] =  pd.to_datetime(df['Submitted'], format='%Y-%m-%d').dt.date
df['Time'] = pd.to_timedelta(df['Time'])
Now, we need to make a couple of changes to our dataframe to get it in shape for plotting. First we have to to pivot it so that each row shows the times obtained by each runner, and each column a date:
dfPiv = df.pivot_table(
    index='Runner', columns='Date', values='Time', aggfunc='first'
)
dfPiv = dfPiv.reset_index().set_index('Runner')
dfTrs = dfPiv.transpose()
This gets the dataframe in the right shape but it only contains entries for every runner at the date they did the run (and NAs everywhere else). To fix this, we need to fill the NA values with the latest valid entry in the row (name):
dfPad = dfTrs.fillna(
    value=None, method='ffill', axis=None,
    inplace=False, limit=None, downcast=None
).transpose()
And, finally, we rank each column (date) by time:
dfRnk = dfPad.rank(ascending=True, method='first', axis=0)
We export our dataframe and we are finally ready to plot our data! For more info on this part of the exercise, follow the code.
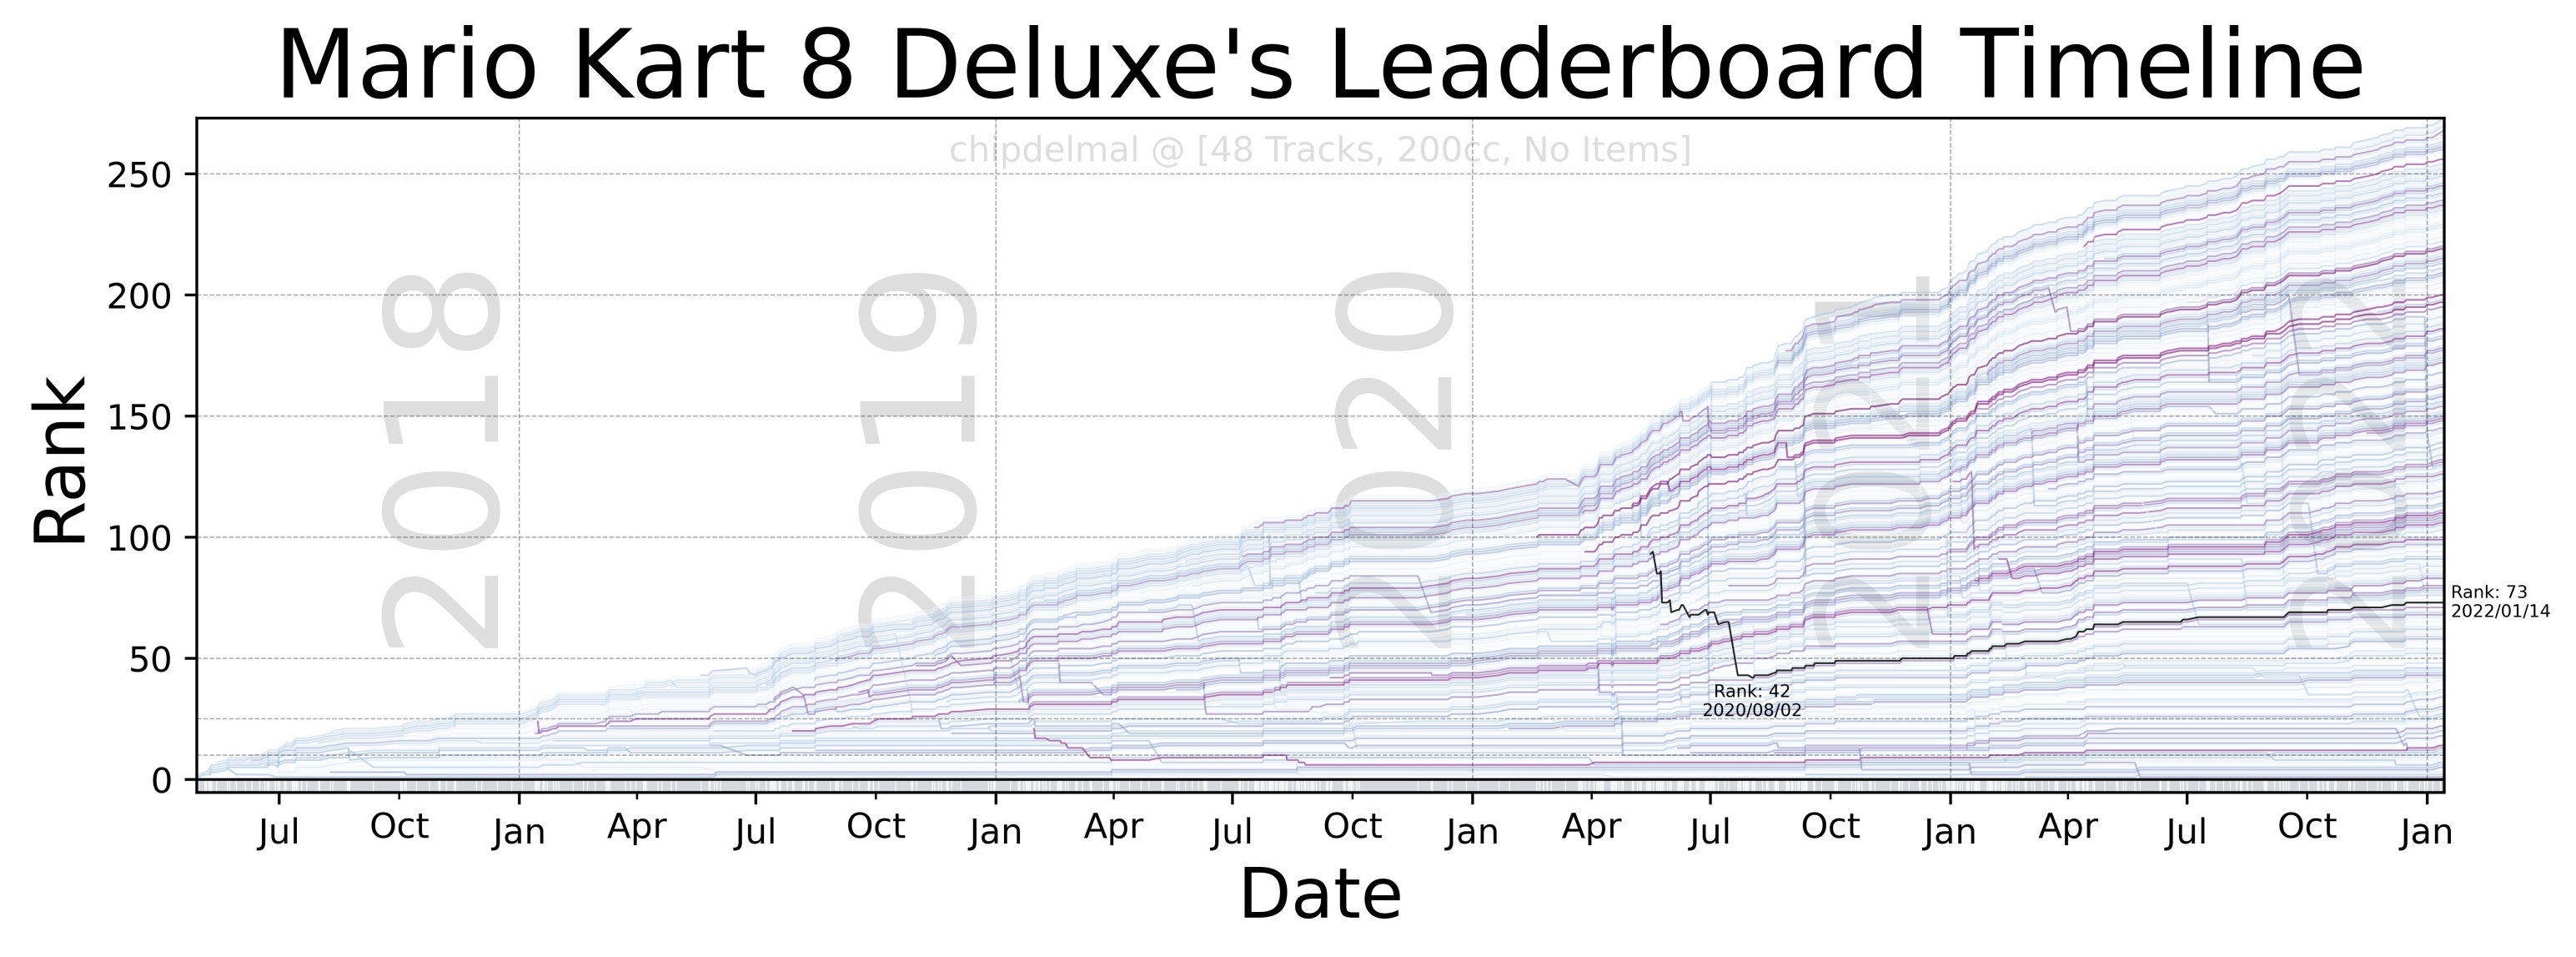
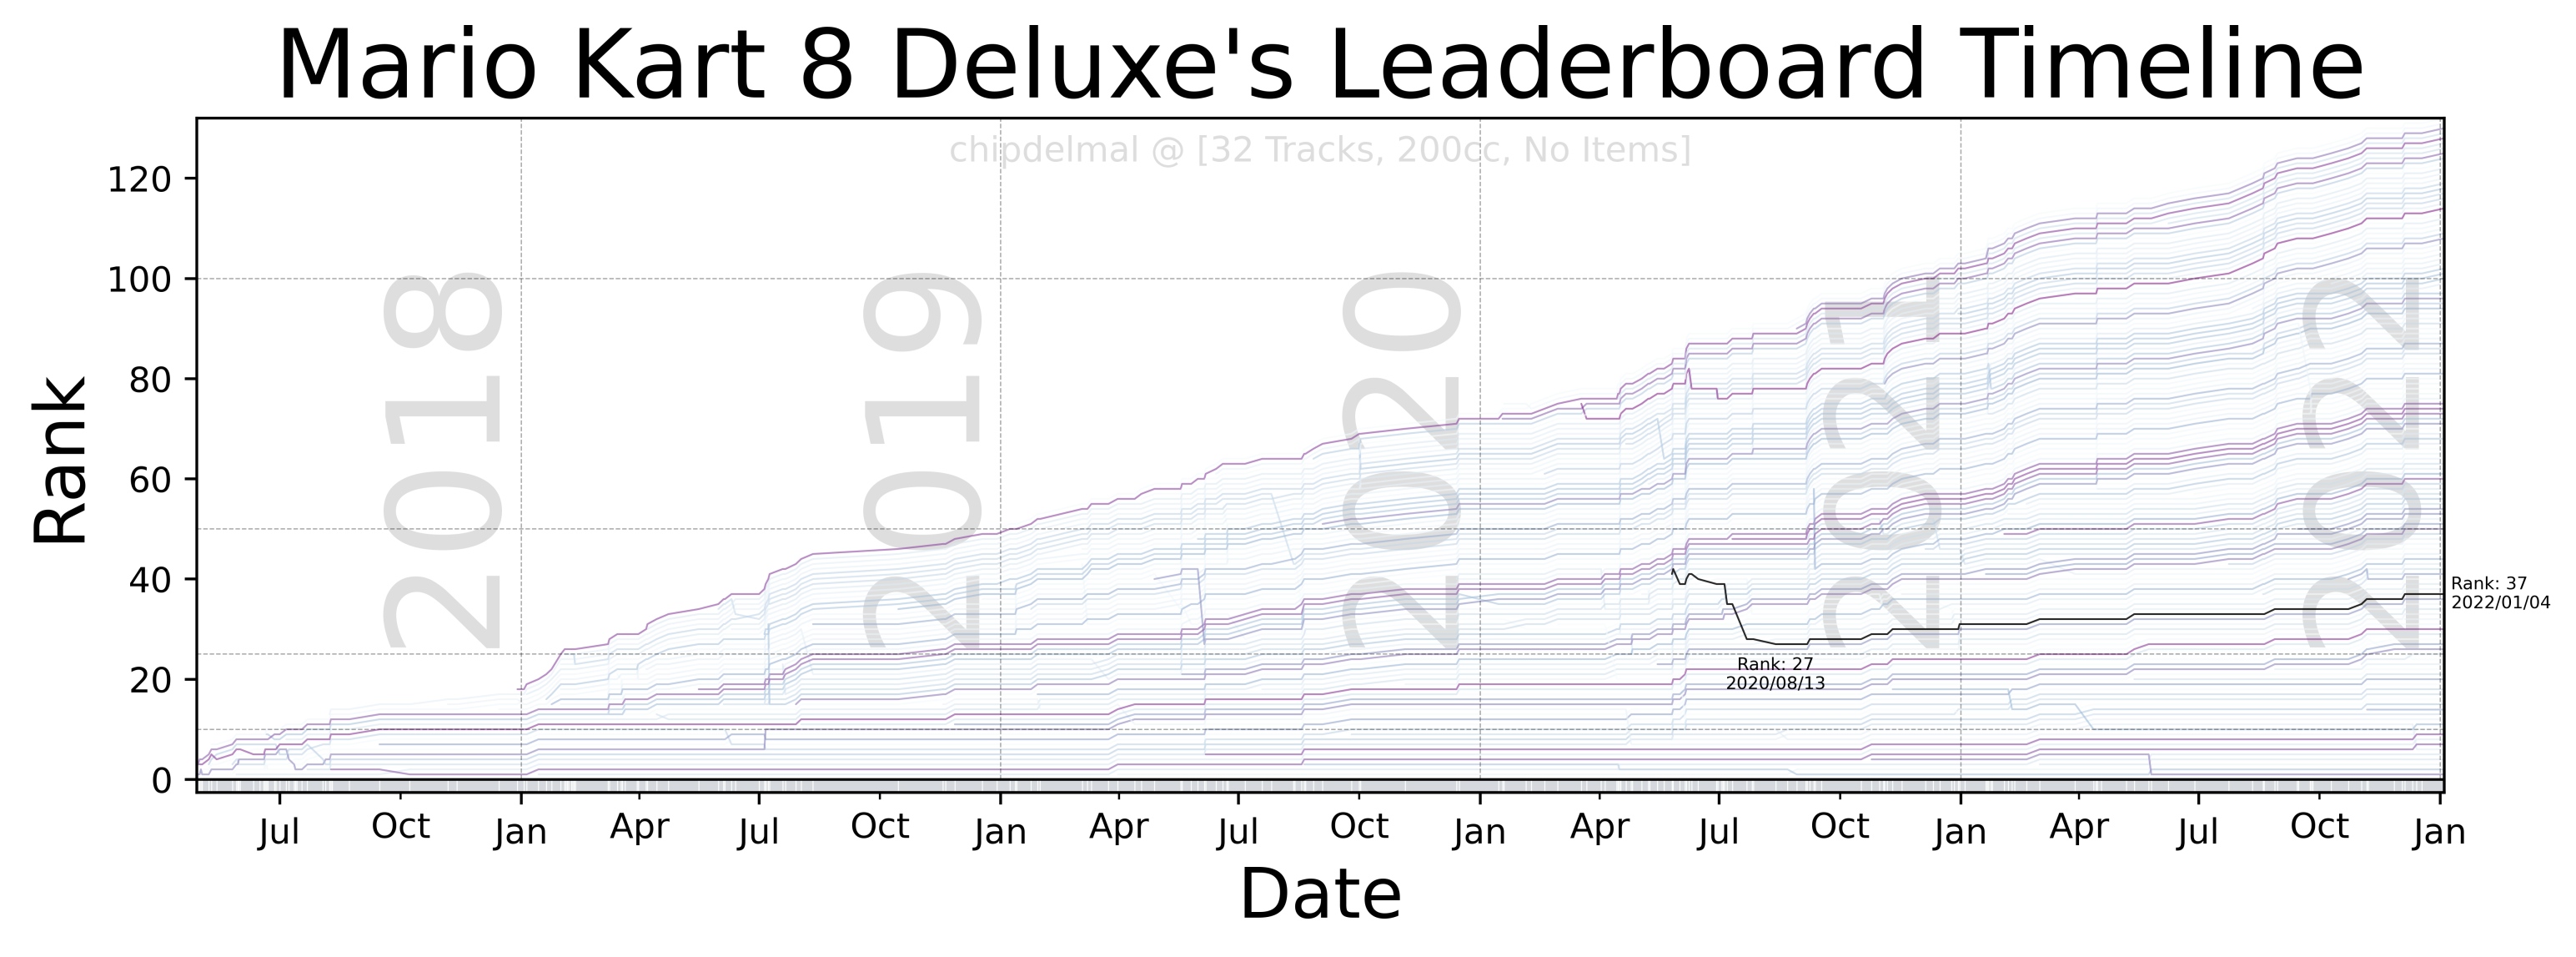
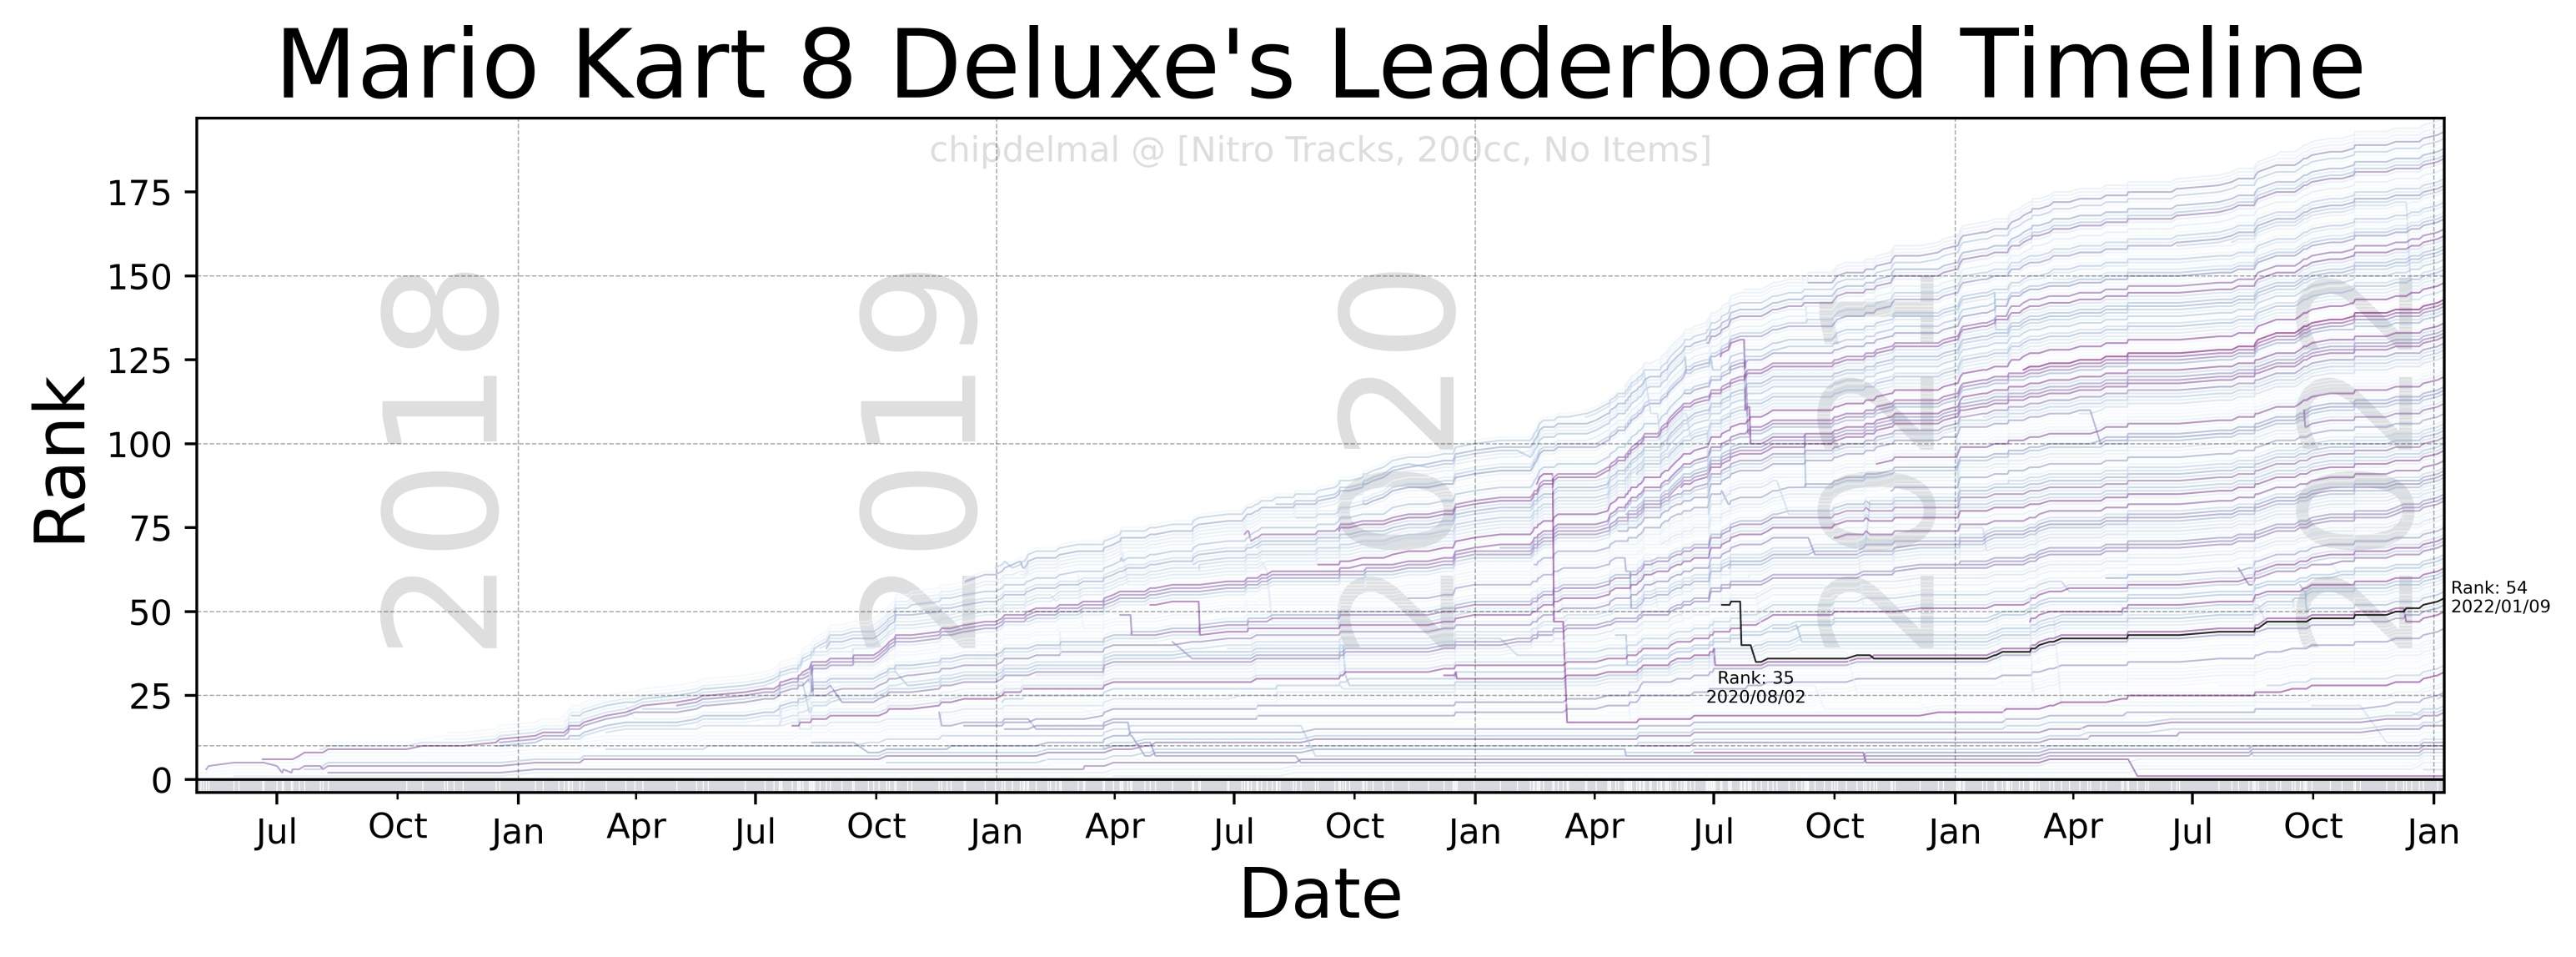
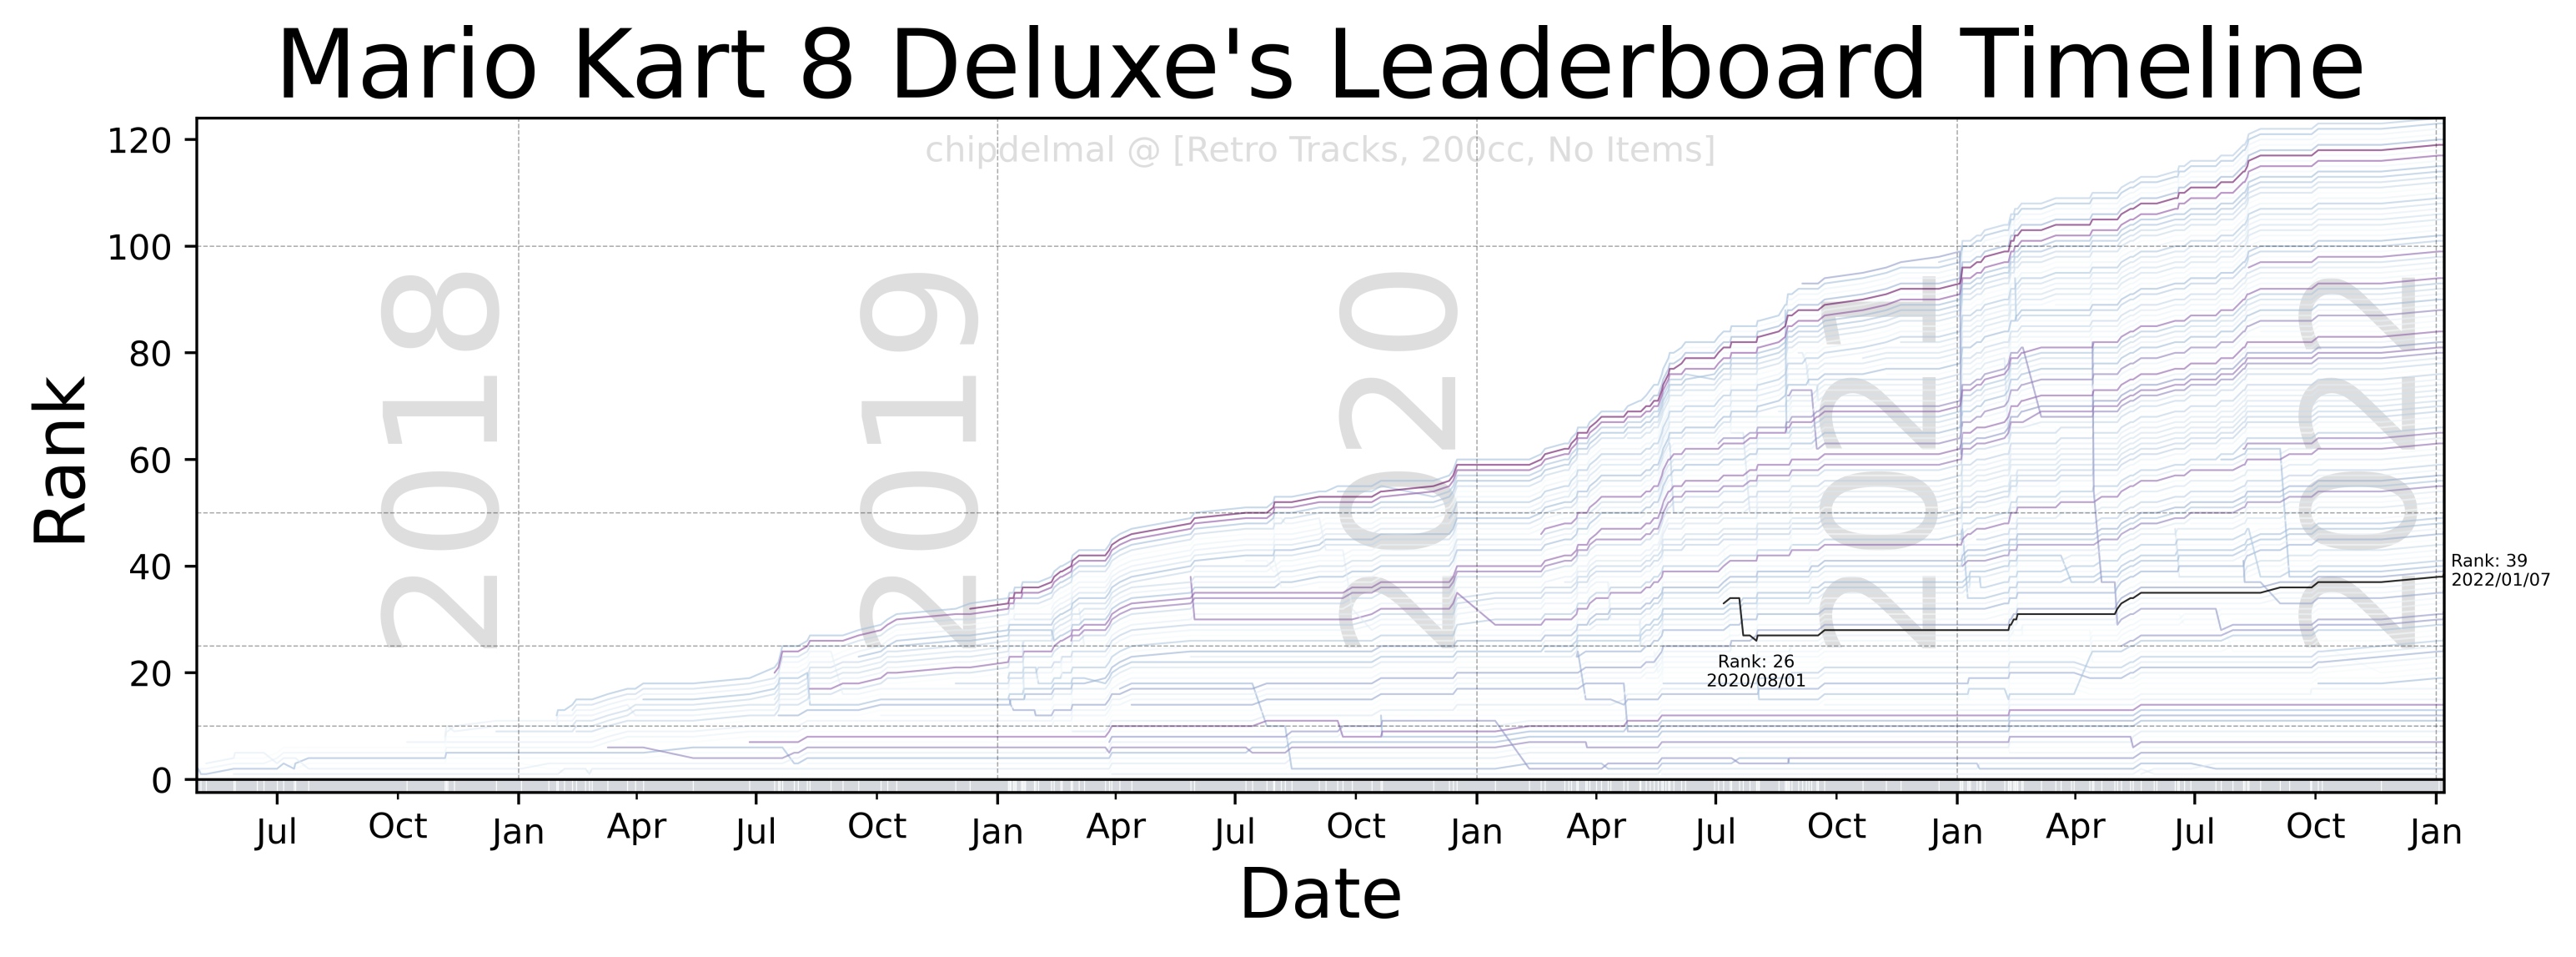
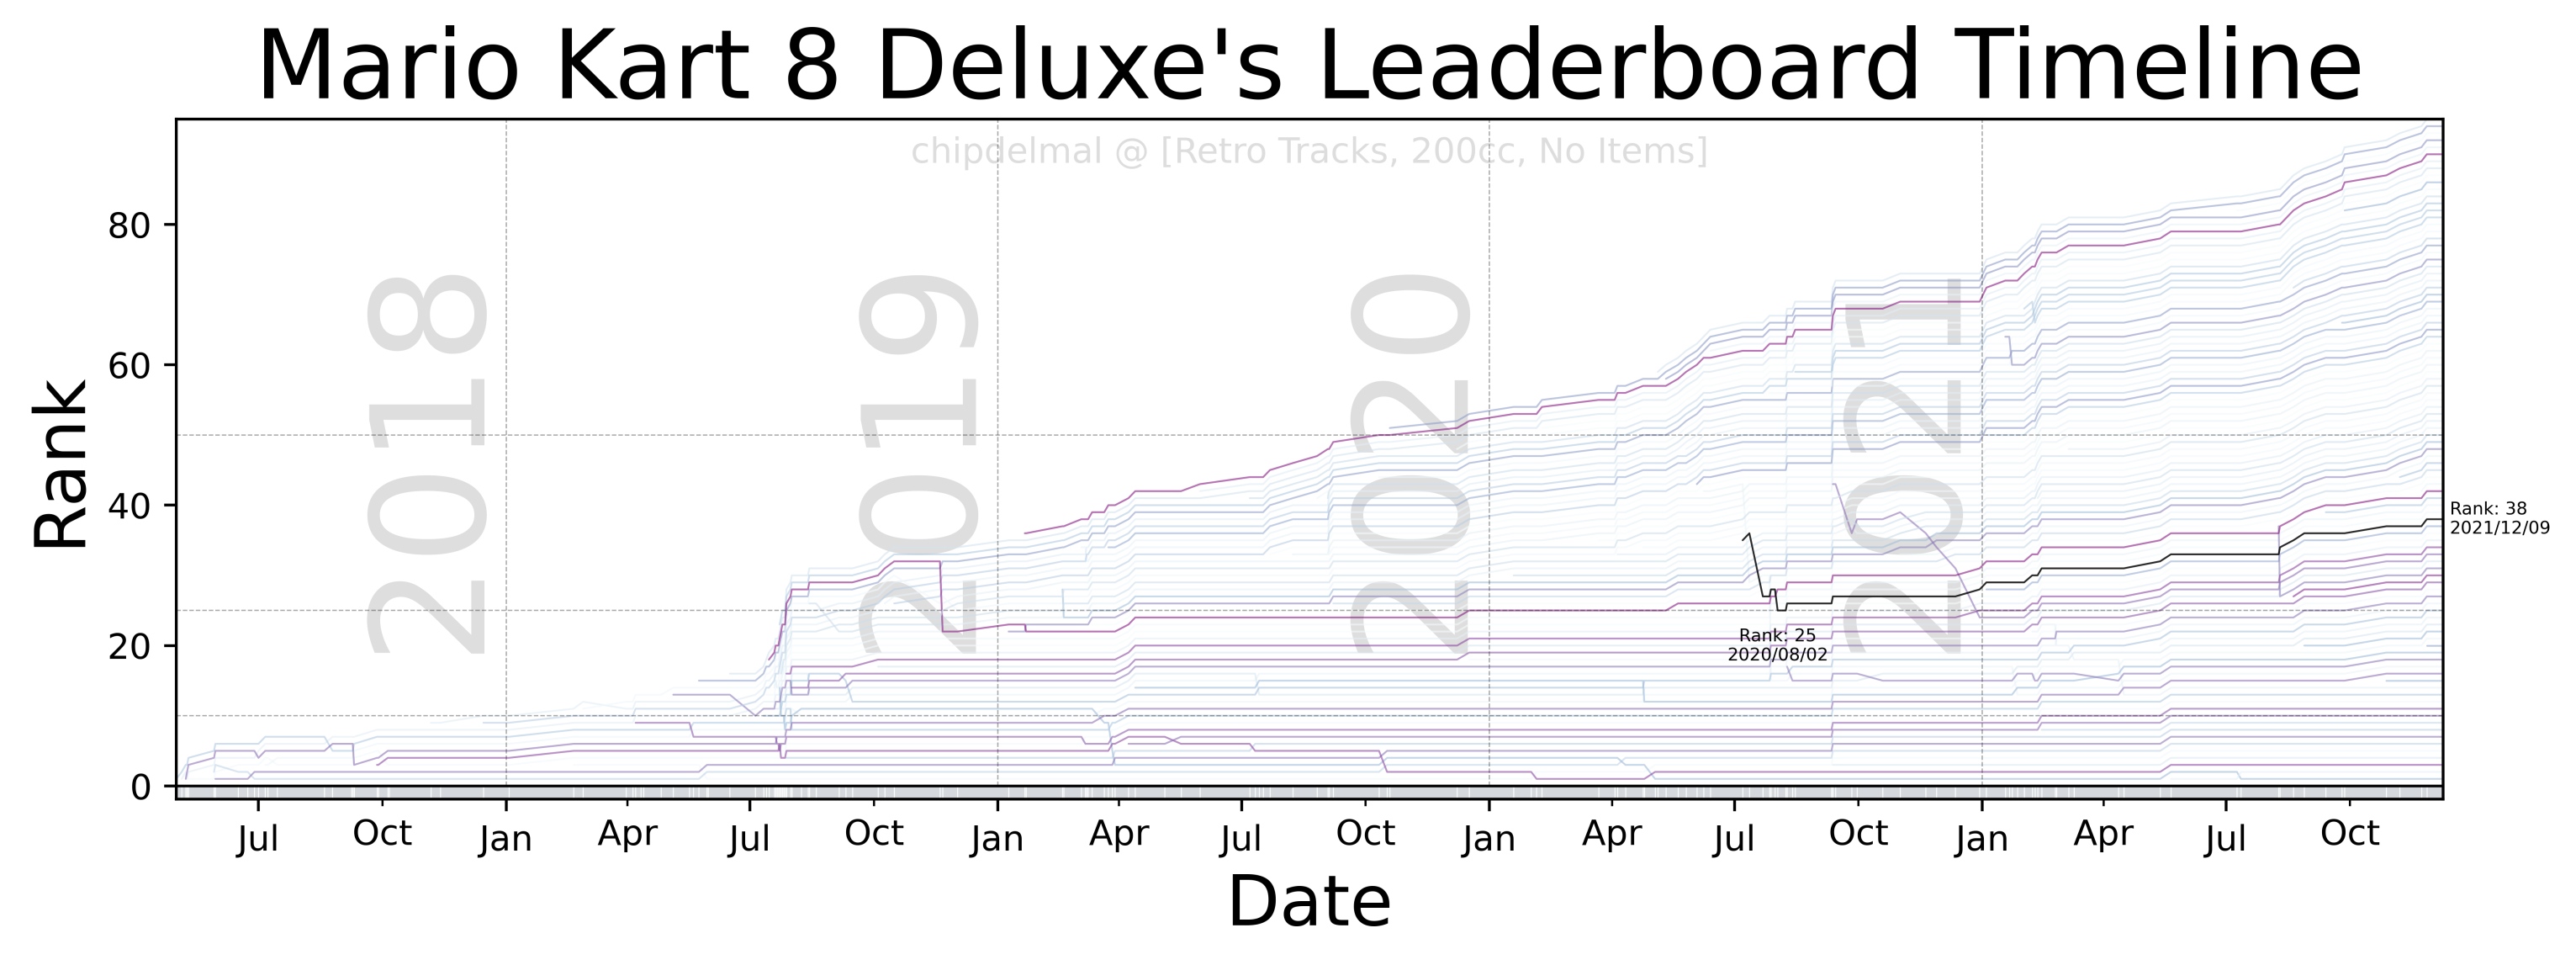
Bump-Chart
Now, for the fun part, the idea of this bump-chart is to show each runner as a trace in an xy plane in which the x-axis shows the date at which different runs took place, the y-axis is the runner’s rank in the leaderboard (at any given point in time), and each trace in the plot is the history of ranks obtained by a particular runner. As there are a lot of runners in the dataset, it is impossible to make each one readable but we are going to highlight one to track the history of the runs (in this case, we will be highlighting mine chipdelmal).
I’m not going to show the whole code-set for this part, as it involves a lot of tweaking and styling but the whole script can be obtained here.
Wrapping Up
Unfortunately, the speedrun.com website changes a lot and in quite erratic ways, so it’s possible that some parts of the scrapers need tweaking in the future but this has been a fun exercise in compiling a dataset and plotting data from a game I love. I also added a bash script to automate the process in the hopes that it could run in the background but it does require the browser to be launched in an “interactive session”, so I I haven’t been able to run it headless. Either way, once selenium is correctly setup, it’s quite useful for auto-scraping the leaderboard sets.
Code Repo
- Repository: Github Repo (Part 1, Part 2, Part 3, Part 4)