Coding a python package to extract and share color palettes from artworks.
Some time ago I ran into BlakeRMill’s MetBrewer package and started thinking of combining some of my previous works on color palettes to generate swatches from artworks. This would serve as an exercise/oportunity to improve my old code, to share some hopefully nice color palettes, and to force myself to use more color palettes in my DataViz work.

Intro
One of the main goals of this package is to automate the extraction of color palettes from works of art for their future use in data visualization applications. In this first part, I will go through the core clustering functions in the package, as well as some of the decisions that went into them in laying the foundations for the rest of the code structure.
Code Dev
This inital phase of the project is comprised of four steps to take an image all the way to a swatched version of itself, along with the list of its dominant colors. The whole codebase is available here.
Preprocessing Image
Some clustering algorithms like Agglomerative Clustering don’t scale well with the number of entries in the dataset. To make them work in a reasonable amount of time for our application we need to re-scale our input images. The following function takes an image and re-scales it to a given pair of dimensions:
def resizeCV2ImageAspect(image, width=None, height=None, inter=cv2.INTER_AREA):
    dim = None
    (h, w) = image.shape[:2]
    if width is None and height is None:
        return image
    if width is None:
        r = height / float(h)
        dim = (int(w * r), height)
    else:
        r = width / float(w)
        dim = (width, int(h * r))
    resized = cv2.resize(image, dim, interpolation=inter)
    return resized
Now, for this application, it’s useful to have a function that scales the longest side to a fixed number of pixels, so that we don’t have to figure out if the image is in landscape or portrait form. To do this, we define the following helper function:
def resizeCV2BySide(img, maxSize):
    if img.shape[0] > img.shape[1]:
        resized = resizeCV2ImageAspect(img, width=maxSize)
    else:
        resized = resizeCV2ImageAspect(img, height=maxSize)
    return resized
Clustering
Most applications and tutorials for clustering use k-means as the algorithm to identify the main colors in an image. In this application, however, I wanted different algorithms to be readily available for the user, so I defined my dominant color function as:
from sklearn.cluster import AgglomerativeClustering

def calcDominantColors(
      img,
      cFun=AgglomerativeClustering,
      cArgs={'n_clusters': 10, 'linkage': 'ward'}
    ):
    frame = img.reshape((img.shape[0]*img.shape[1], 3))
    cFit = cFun(**cArgs).fit(frame)
    labels = cFit.labels_
    return (frame, labels, cFit)
Where the img is an open-cv-compatible image, cFun is a clustering function compatible with scikit-learn, and cArgs are its arguments and options. This function can be used as follows:
from sklearn.cluster import AgglomerativeClustering

CLUSTERING = {
    'algorithm': AgglomerativeClustering,
    'params': {
        'n_clusters': CLST_NUM,
        'compute_full_tree': True,
        'linkage': 'ward'
    }
}

(pixels, labels, cFit) = art.calcDominantColors(
    resized,
    cFun=CLUSTERING['algorithm'],
    cArgs=CLUSTERING['params']
)
Now, the output from this function gives us the pixels and their labels but not their color itself. To get the centroid of the colors, we define the following routine:
def colorClusterCentroid(cluster, cFun=np.median, round=True):
    cntr = [cFun(cel) for cel in cluster.T]
    if round:
        return [int(c) for c in cntr]
    else:
        return cntr
And wrap it up as follows, so that we get our colors in hex form:
def getDominantSwatch(
        pixels, labels,
        grpFun=np.median, round=True
    ):
    cntLbls = [i[0] for i in Counter(labels).most_common()]
    clusters = [pixels[labels==i] for i in cntLbls]
    swatch = [
        (
            Color(rgbToHex(colorClusterCentroid(c, cFun=grpFun, round=round))),
            c.shape[0]
        )
        for c in clusters
    ]
    return swatch
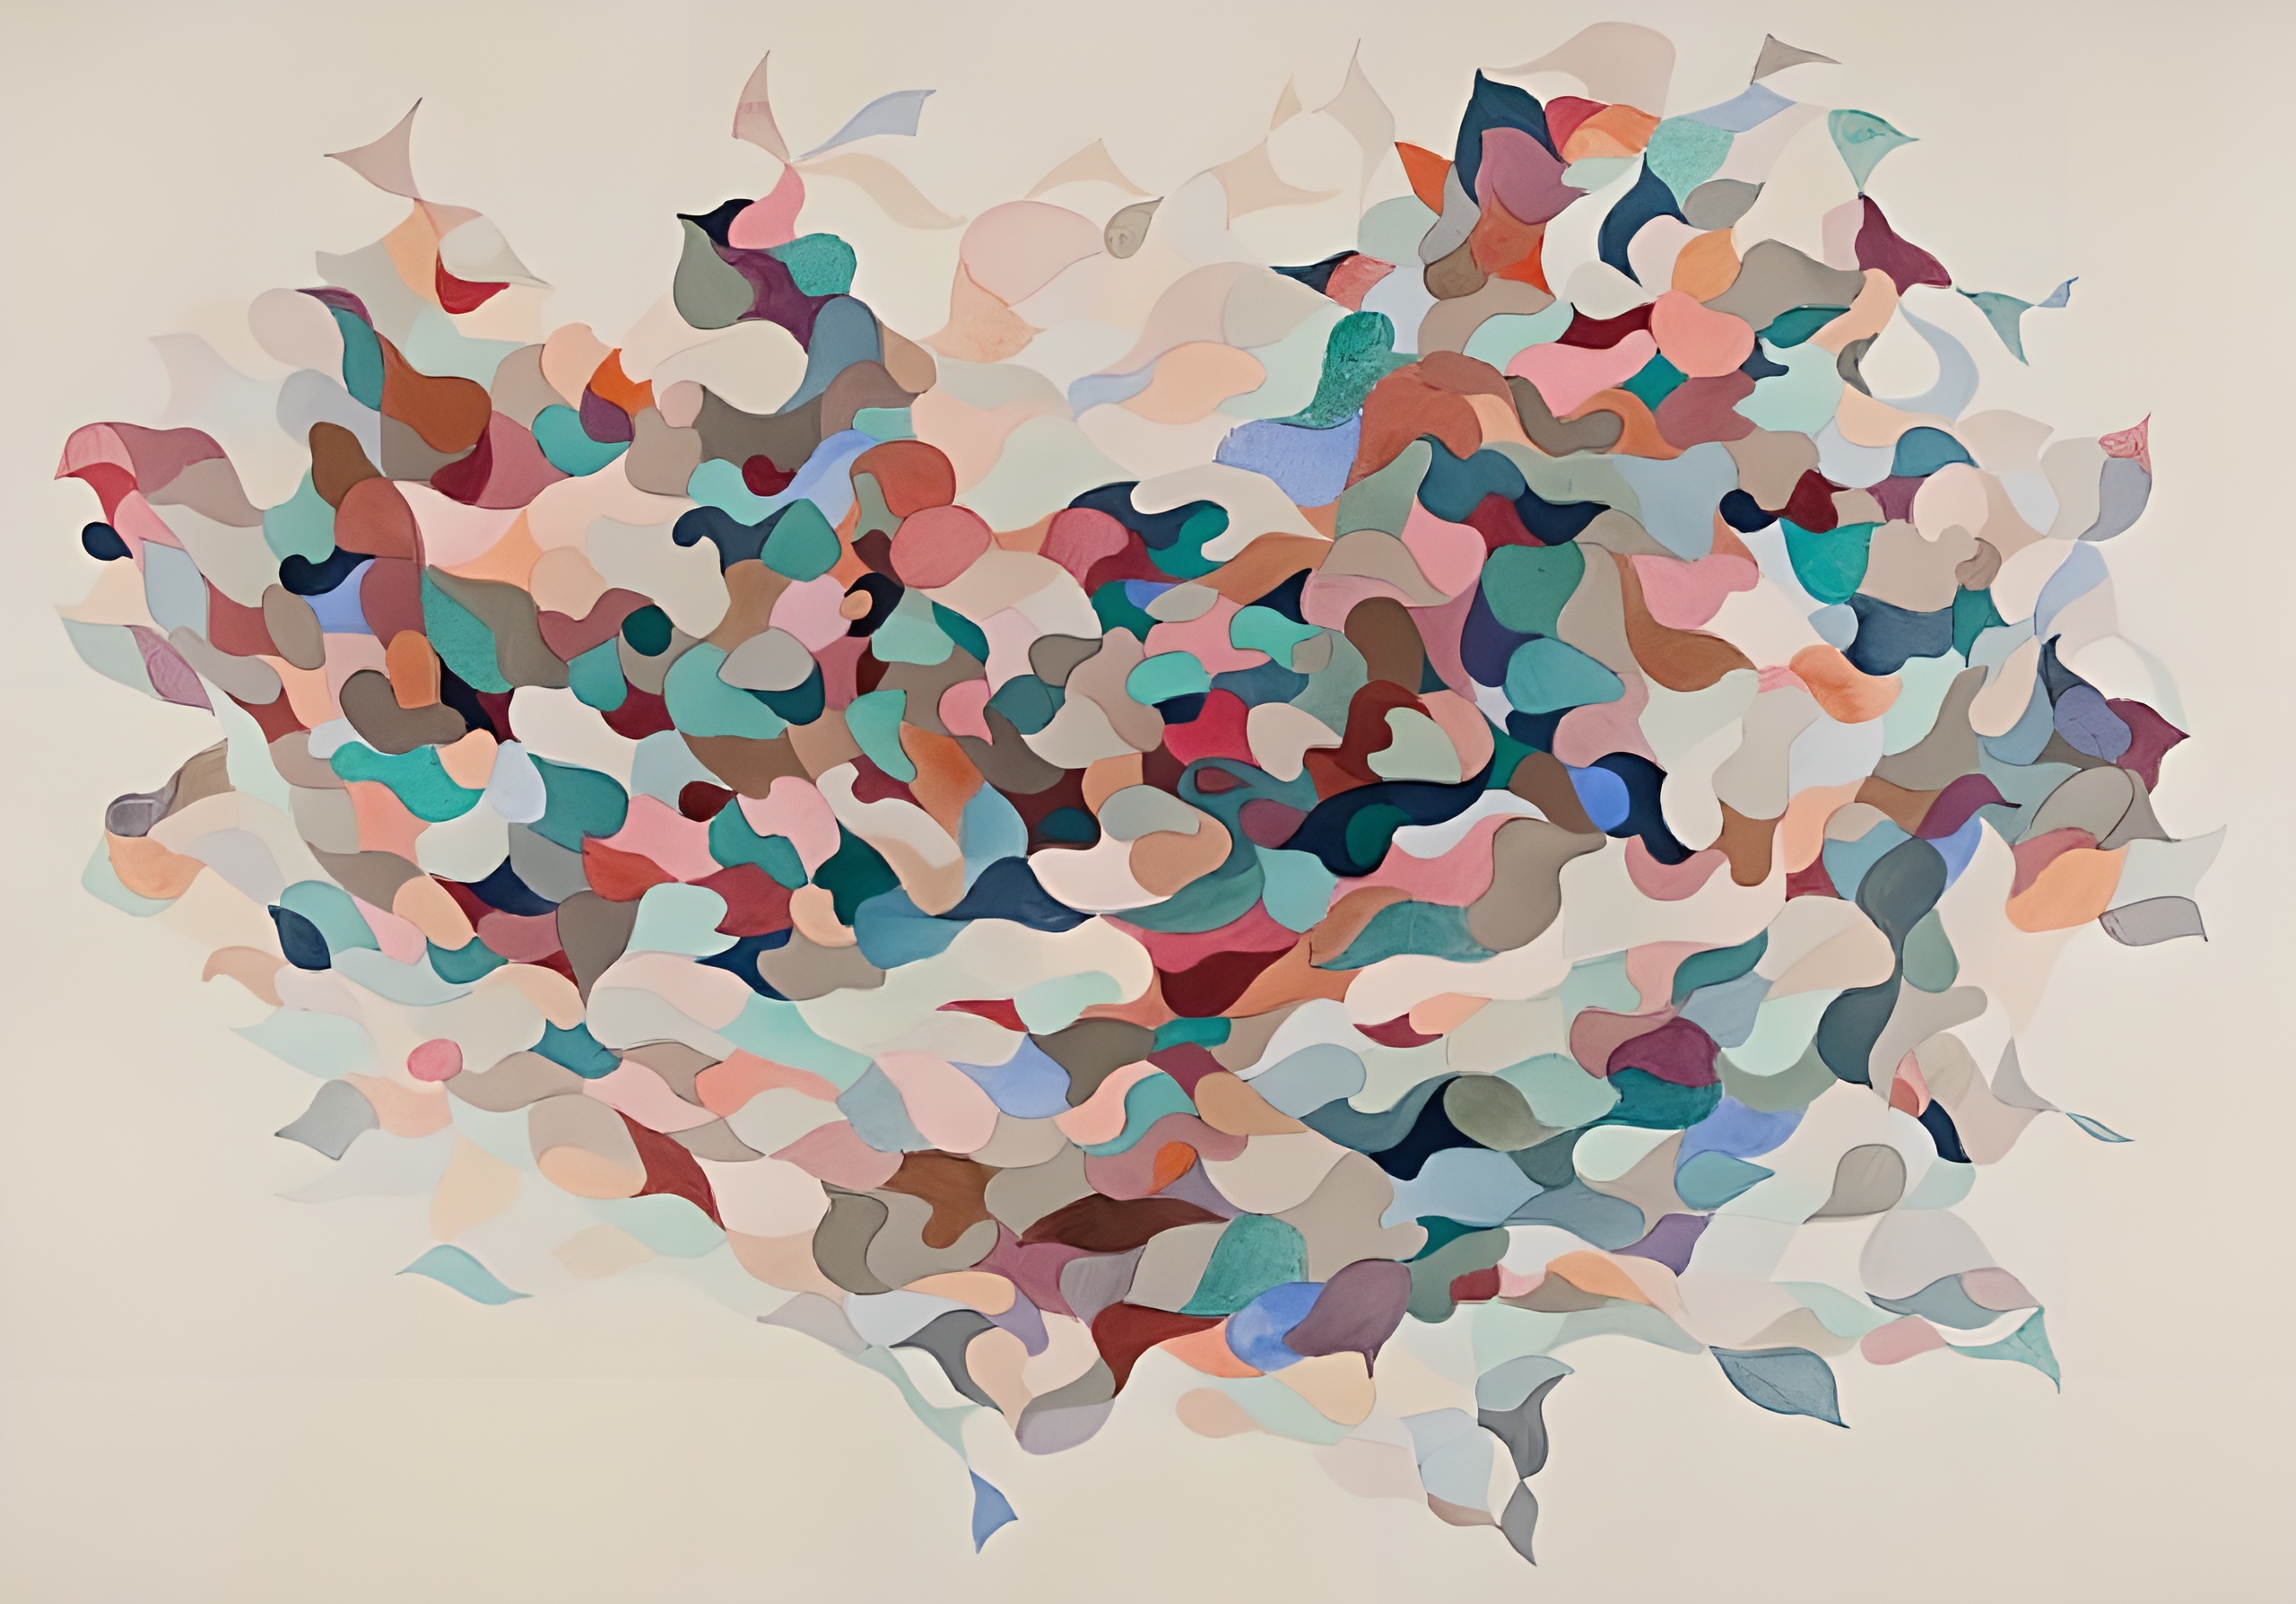
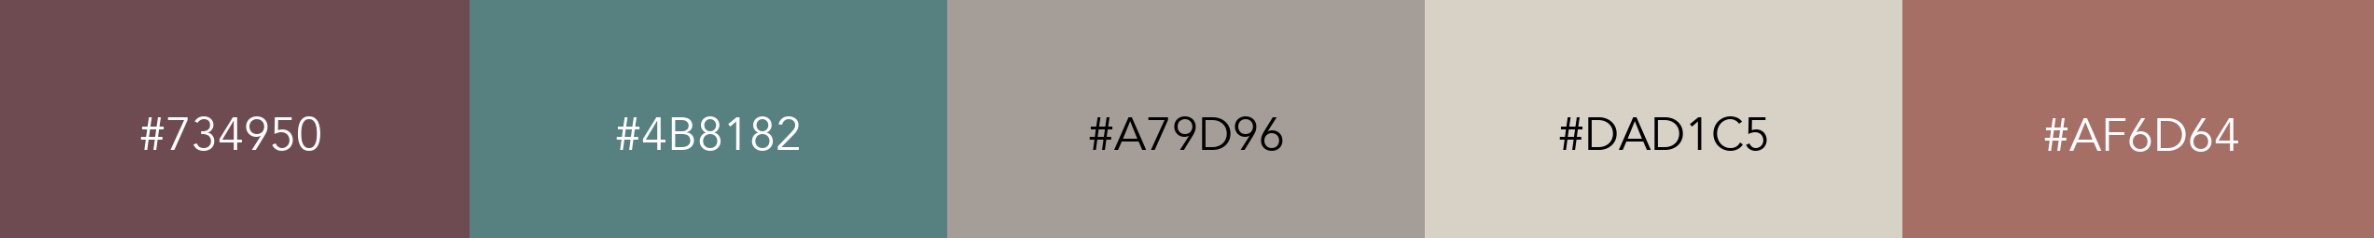
In this example we will be using Edna Andrade’s “Atom Cloud” to identify the artwork’s five dominant colors:
Generating Swatch
In this step, we will be generating the colors swatch to be appended to our image to get a nice representation of the clustering product.
Sorting Colors
Sorting colors in two dimensions is not an easy task. As described in this post, laying out a color swatch in a perception-based way involves making some sacrifices. Fortunately, the colorir package has a function that does a good job in that regard (hue_sort_key).
def sortSwatchHSV(
        freqSwatch,
        hue_classes=None, gray_thresh=255,
        gray_start=True, alt_lum=True, invert_lum=False
    ):
    swatchHex = [s[0].hex for s in freqSwatch]
    swatchHex.sort(
        key=cir.hue_sort_key(
            hue_classes=hue_classes, gray_thresh=gray_thresh,
            gray_start=gray_start, alt_lum=alt_lum, invert_lum=invert_lum
        )
    )
    swatchHex = [Color(c) for c in swatchHex]
    return swatchHex
In addition, we provide a function that sorts the colors in a frequency-based way according to cluster size as an alternative:
def sortSwatchByFrequency(freqSwatch):
    freqSwatch.sort(key=lambda rgb: colorsys.rgb_to_hsv(*rgb[0].get_rgb()))
    swatchHex = [s[0] for s in freqSwatch]
    return swatchHex
Creating Image Bars
Now, we move to create the color bars so that we can append them to our image later on:
def genColorSwatch(img, barsHeight, swatch, proportionalHeight=True):
    palette = [hexToRgb(c) for c in swatch]
    clstNumber = len(palette)
    (height, width, depth) = img.shape
    if proportionalHeight:
        pltAppend = np.zeros((round(height*barsHeight), width, depth))
        (wBlk, hBlk) = (round(width/clstNumber), round(height*barsHeight))
    else:
        pltAppend = np.zeros((barsHeight, width, depth))
        (wBlk, hBlk) = (round(width/clstNumber), barsHeight)
    for row in range(hBlk):
        colorIter = -1
        for col in range(width):
            if (col%wBlk==0) and (colorIter<clstNumber-1):
                colorIter=colorIter+1
            pltAppend[row][col] = palette[colorIter]
    return pltAppend*255

Text Hue
Additionally, if we want to print our hex values in the color swatch we want a function that decides if the text color should be white or black to make it readable, so we define a function that does that (based on these answers in stackoverflow):
def getTextColor(hexBackground, threshold=20):
    (r, g, b) = hexBackground.rgb
    tcol = (0, 0, 0) if (r*0.299+g*0.587+b*0.114)>threshold else (1, 1, 1)
    return Color(rgb=tcol)

def addHexColorText(
        barsImg, swatchHex,
        font='Avenir', fontSize=75, hexLabel=True
    ):
    font = ImageFont.truetype(aux.getFontFile(family=font), fontSize)
    draw = ImageDraw.Draw(barsImg)
    (W, H) = (barsImg.width/len(swatchHex), barsImg.height/2)
    for (ix, hex) in enumerate(swatchHex):
        (colorHex, colorRGB) = (hex.hex.upper(), hex.rgb)
        tcol = sws.getTextColor(hex)
        label = (
            colorHex
            if hexLabel else
            str(tuple([int(255*i) for i in colorRGB]))
        )
        # Generate bbox and draw centered -------------------------------------
        bbox = draw.textbbox(xy=(0, 0), text=label, font=font, align='center')
        (w, h) = (bbox[2]-bbox[0], bbox[3]-bbox[1])
        xy = (((2*ix+1)*W-w)/2, H-h/2)
        draw.text(
            xy, label,
            tuple([int(255*i) for i in tcol.rgb]),
            font=font, align='center'
        )
    return barsImg
Wrapping Everything Up
With all these pieces in place, we can put everything into a nice wrapper as follows:
def getSwatchedImage(
        img, maxSide=150,
        cFun=KMeans, cArgs={'n_clusters': 10, 'max_iter': 1000, 'n_init': 10},
        grpFun=np.median, round=True,
        HSVSort=False, hueClasses=10, grayThreshold=25,
        barHeight=0.15, barProportional=True,
        font='Arial', fontSize=50
    ):
    resized = amg.resizeCV2BySide(img, maxSide)
    (pixels, labels, model) = fng.calcDominantColors(
        resized, cFun=cFun, cArgs=cArgs
    )
    swatch = fng.getDominantSwatch(pixels, labels, grpFun=grpFun, round=round)
    swatchHex = (
        swt.sortSwatchHSV(swatch, hue_classes=hueClasses, gray_thresh=grayThreshold)
        if HSVSort else
        swt.sortSwatchByFrequency(swatch)
    )
    bars = fng.genColorSwatch(
        img, barHeight, swatchHex,
        proportionalHeight=barProportional
    )
    barsImg = fng.addHexColorText(
        Image.fromarray(bars.astype('uint8'), 'RGB'),
        swatchHex, font=font, fontSize=fontSize
    )
    newIMG = np.row_stack([img, barsImg])
    imgOut = Image.fromarray(newIMG.astype('uint8'), 'RGB')
    return {'image': imgOut, 'swatch': swatchHex, 'model': model}
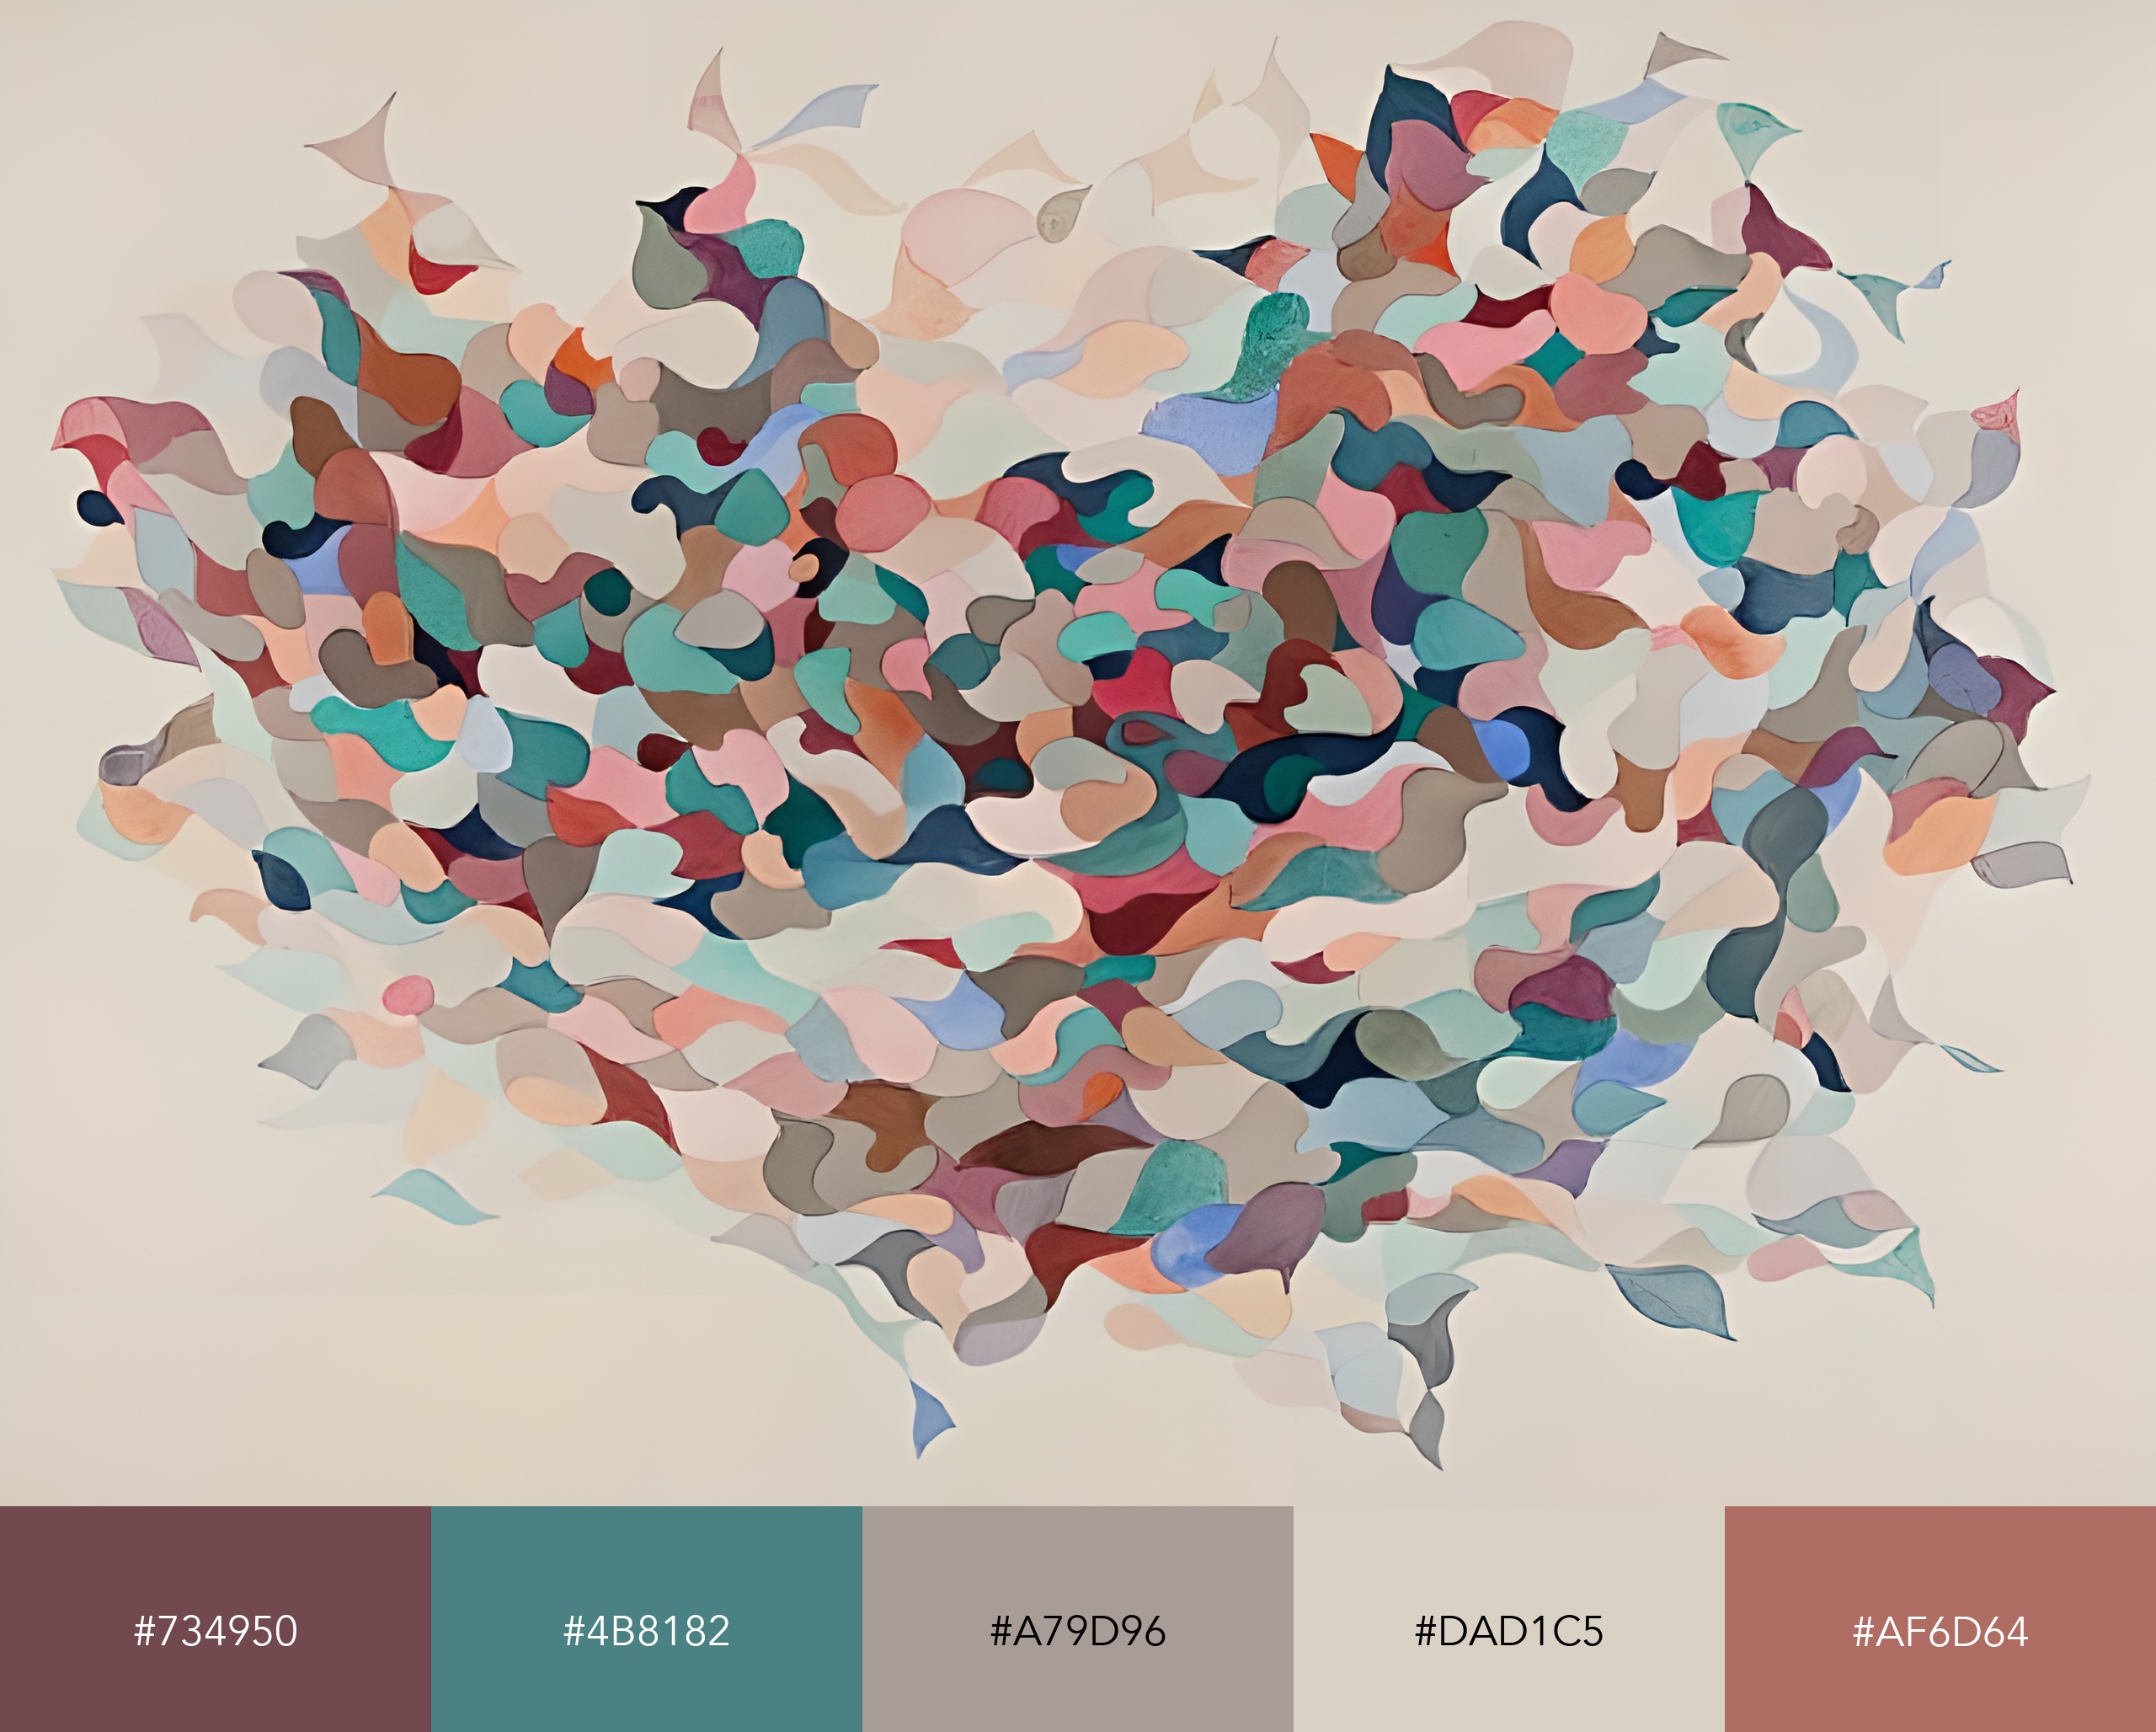
which takes an image as input, and returns something like the following result:
Future Work
This first section went through clustering the colors in the image but we are still far from being able to do it in batches and putting together the color palettes in an installable package. We will go through that process in a post that should come out in the near future!
Code Repo
- Repository and pypi: Github Repo, pypi package
- Dependencies: matplotlib, pandas, numpy, opencv, scikit-learn, Pillow, colour, colorir, compress-pickle