Benchmarks
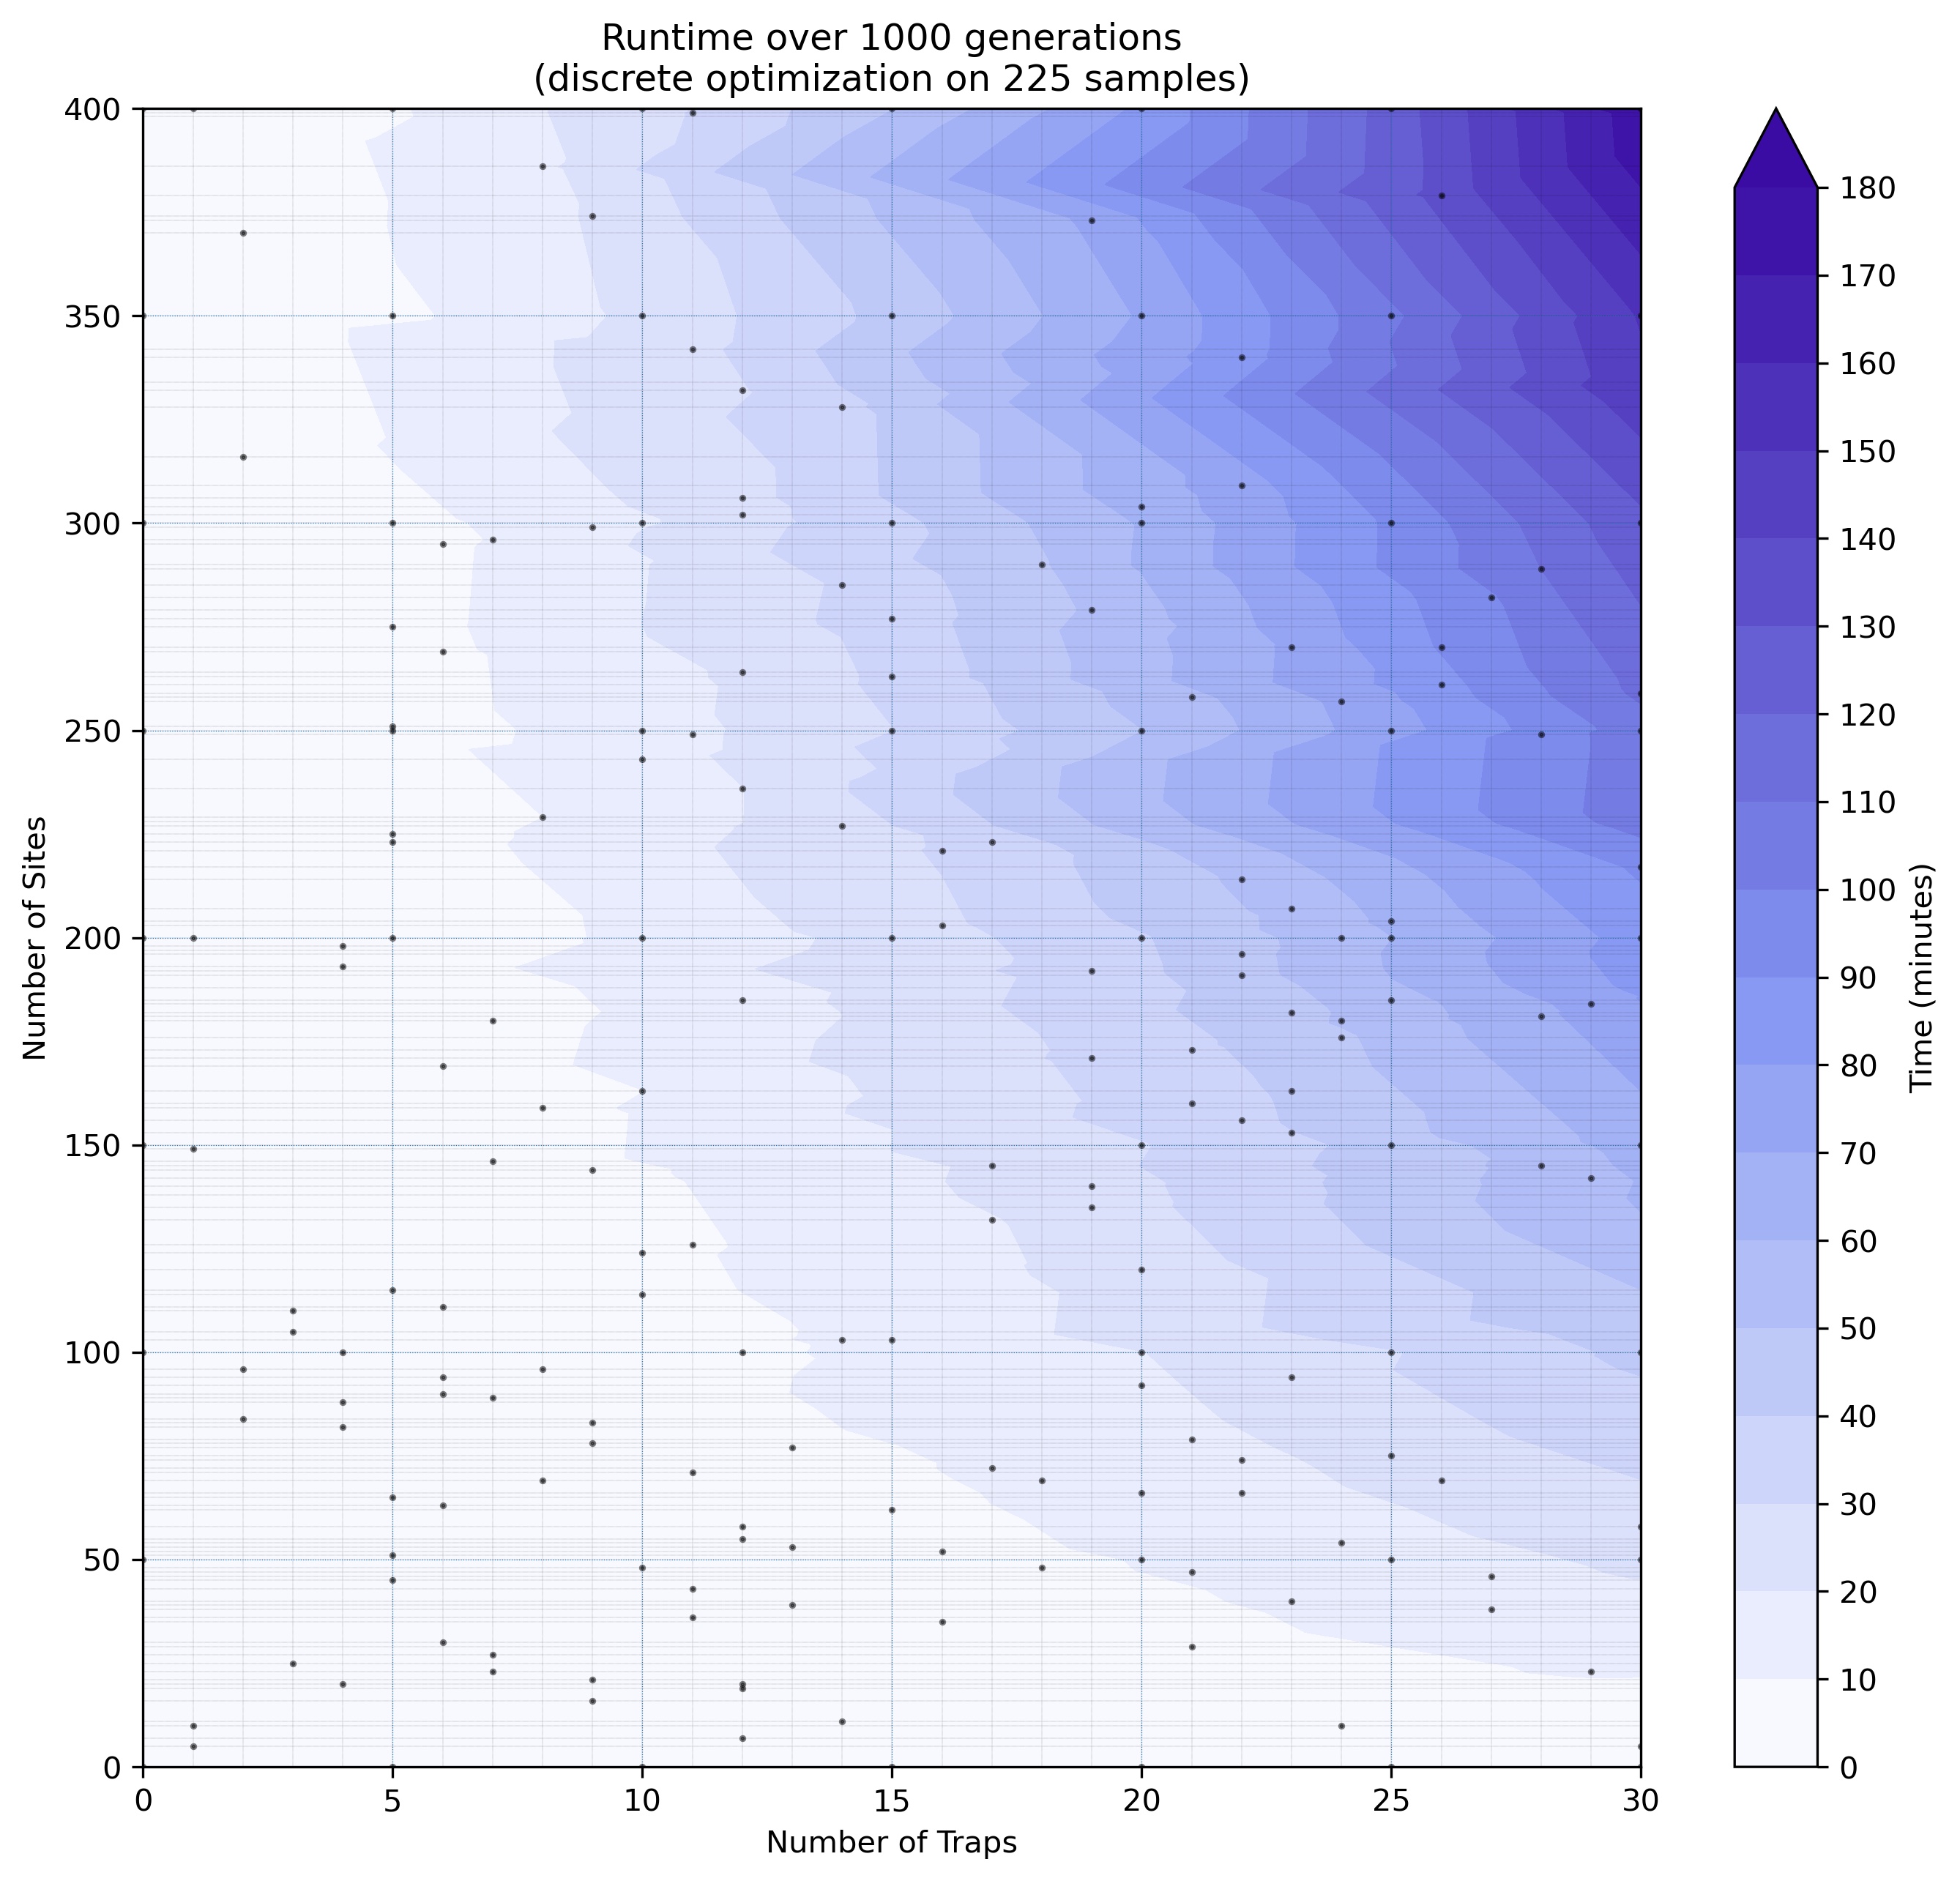
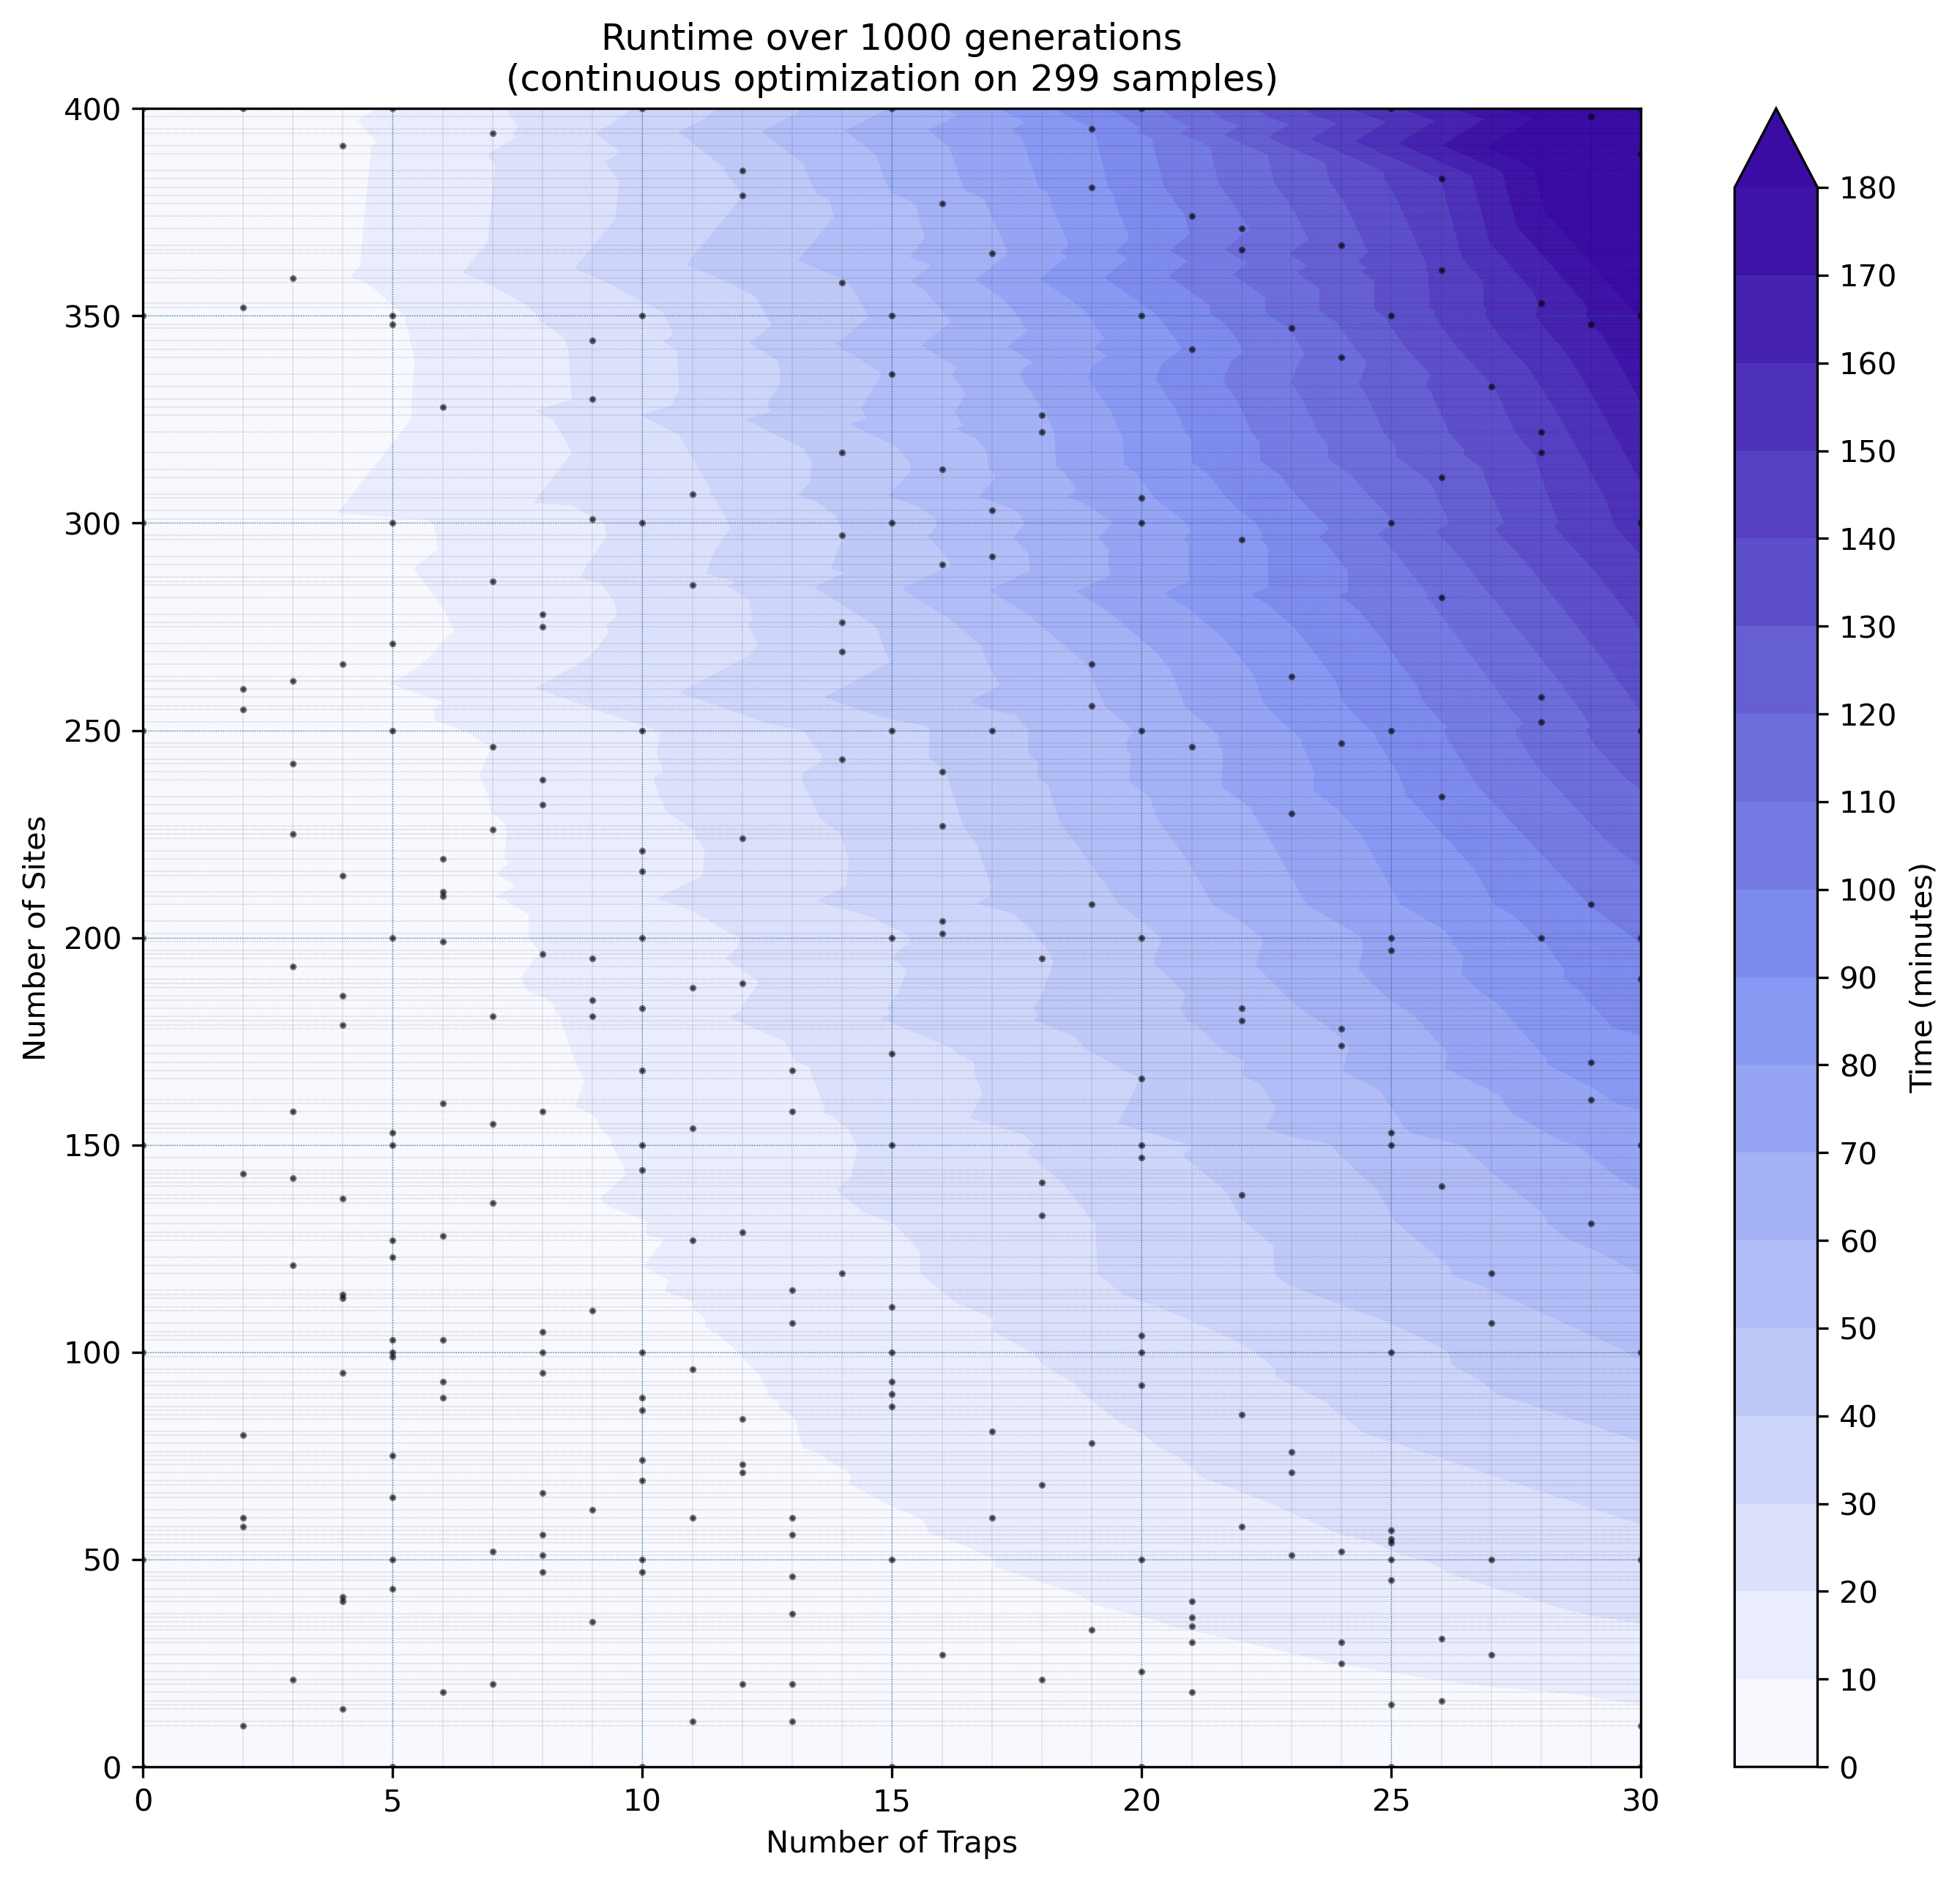
MGSurvE’s optimization runtime depends on several factors but the main ones are the number of sites and traps in our landscape. This is because they are both related to the size of the migration matrix and the number of operations that need to be performed on it. Specifically, these variables both impact the calculation of Markov’s Fundamental Matrix, which is the slowest part of the optimization process.
To provide a reference on how much time we could expect optimization we provide a benchmarking routine.
We ran a set of experiments limiting our server to use 16 cores and ran 5 repetitions of a set of sites-traps combinations (Latin Hypercube Sampling schemes were used) to test how the optimizations time scales (GA parameters were set to auto for consistency).
Both optimization routines (discrete and continuous) were ran over 500 generations, as that gets us a good sample of the timing for each parameter combination (after the optimization algorithm’s memory allocation and initial function calls have taken place).
We are, however, scaling the timing to 1000 generations (doubling it) because that’s closer to the expected number of generations we would run for an optimization task.
Our server has 44 physical cores (two “Intel(R) Xeon(R) CPU E5-2696 v4 @ 2.20GHz”) and 256Gb RAM but, as was previously mentioned, was limited to 16 cores for benchmarking purposes.