MGDrivE (Mosquito Gene Drive Explorer) is a mathematical model created to test and compare gene-drive constructs to reduce the spread of mosquito-borne diseases in complex spatial contexts.
Intro and Context
MGDrivE was my main project when I first arrived at UC, Berkeley. At that time, we were looking for a way to model different mosquito gene constructs in a more streamlined way because up to that point, most of the gene drive modeling was done by “hard-coding” a series of matrices equations taking into account the drive construct and its parameters. This is just a snippet of an example:
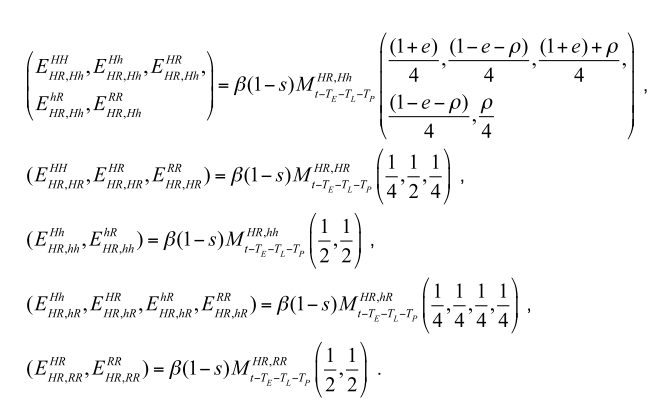
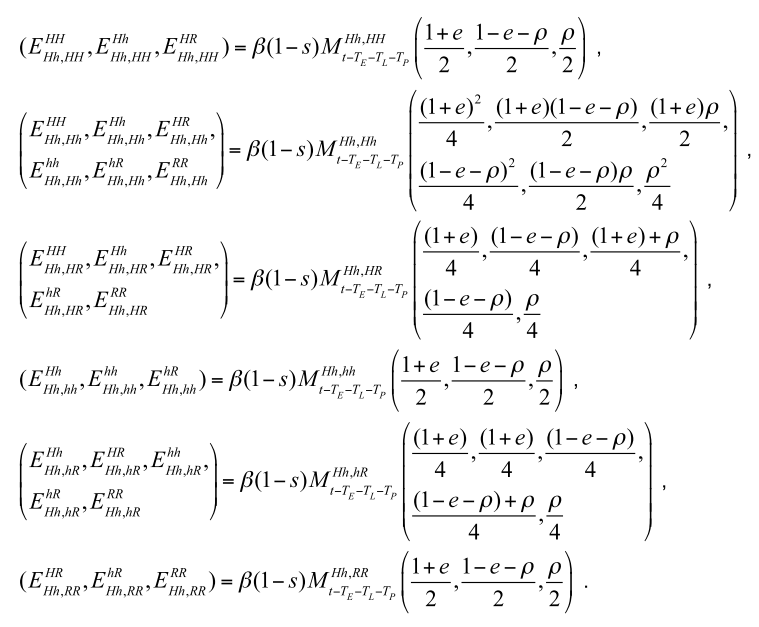
From which it can be seen that there is an underlying matrix structure that we wanted to figure out so that the gene drive component was generalizable.
Additionally, we wanted to extend the model to be able to take into account more than a handful of connected populations, as most papers up to that point dealt only with ad hoc regular landscapes.
Modules
Coming from an engineering background, the first thing that came to mind was to separate the components to be able to analyze and process them independently.
In the original equations we were extending Deredec, Godfray, and Burt; it became quite apparent to me that the mosquito life-cycle was getting mixed with the inheritance aspects of the reproduction; so the first task I wanted to take on was to de-couple these elements.
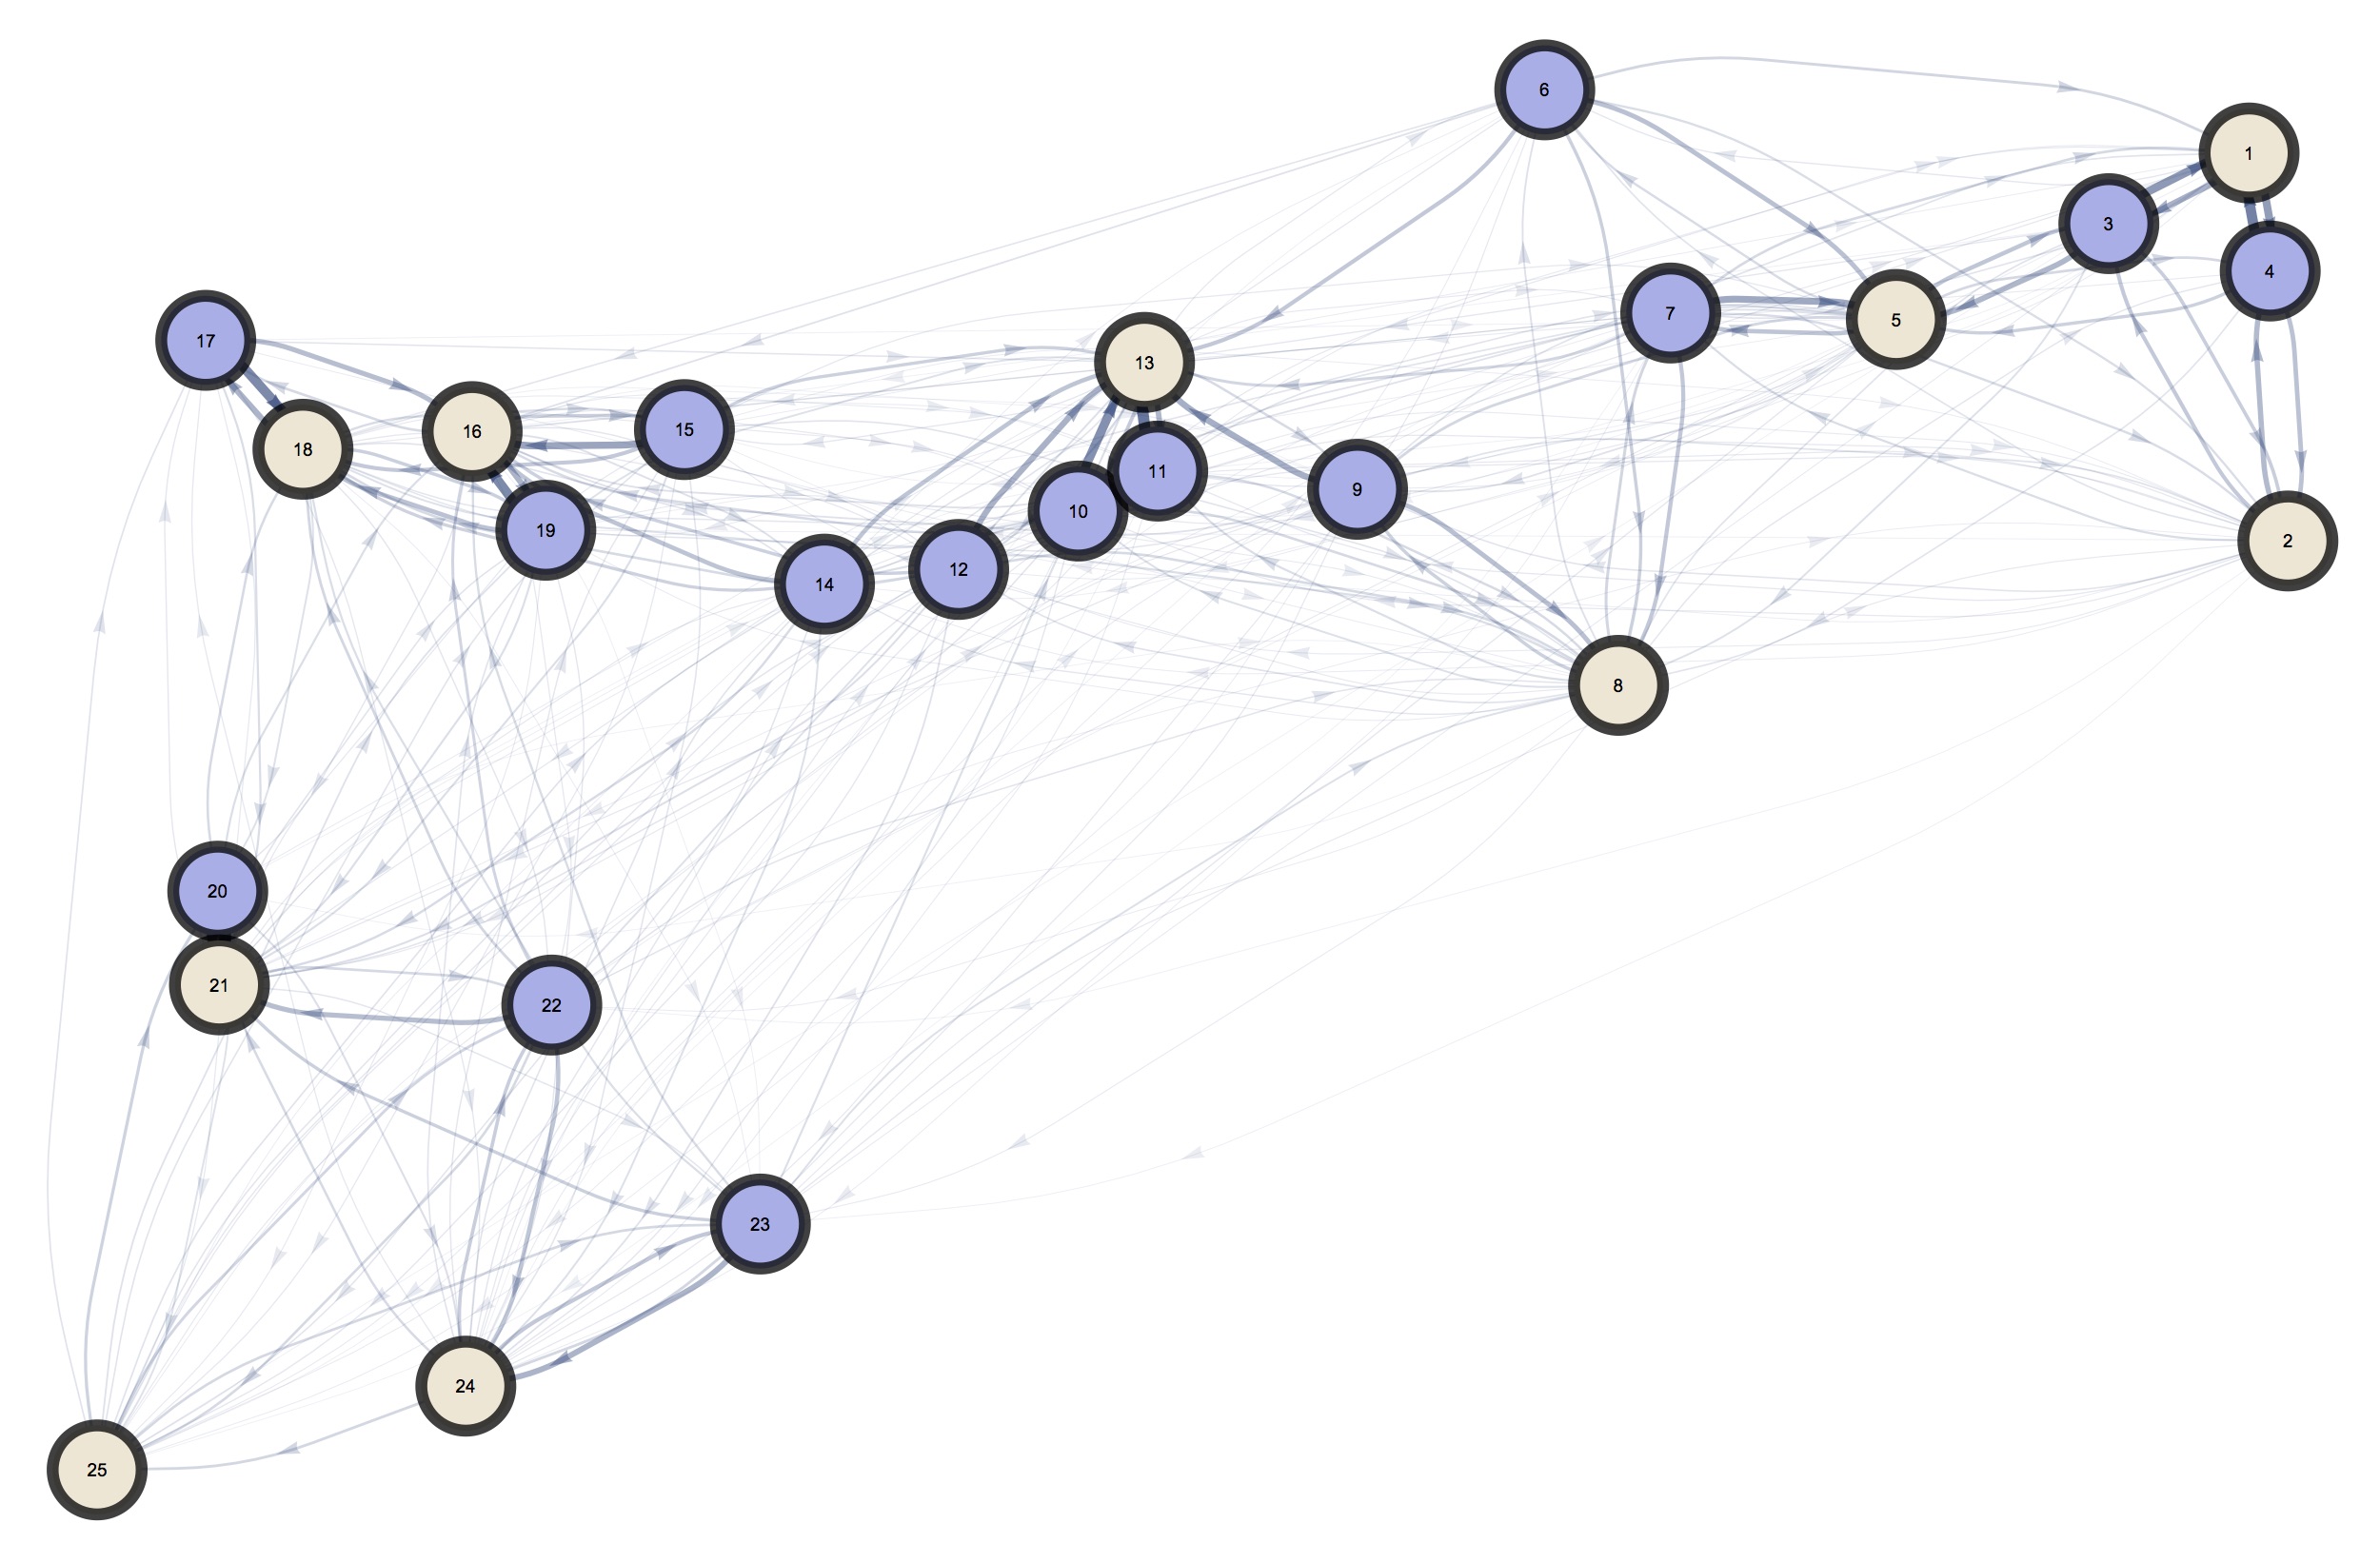
Regarding the spatial context, up to that point I had been working a lot on network theory for different projects, so it was somewhat natural to me to think of it as a network of interconnected mosquito populations in which they could move and mate.
This left us with 3 modules to develop:
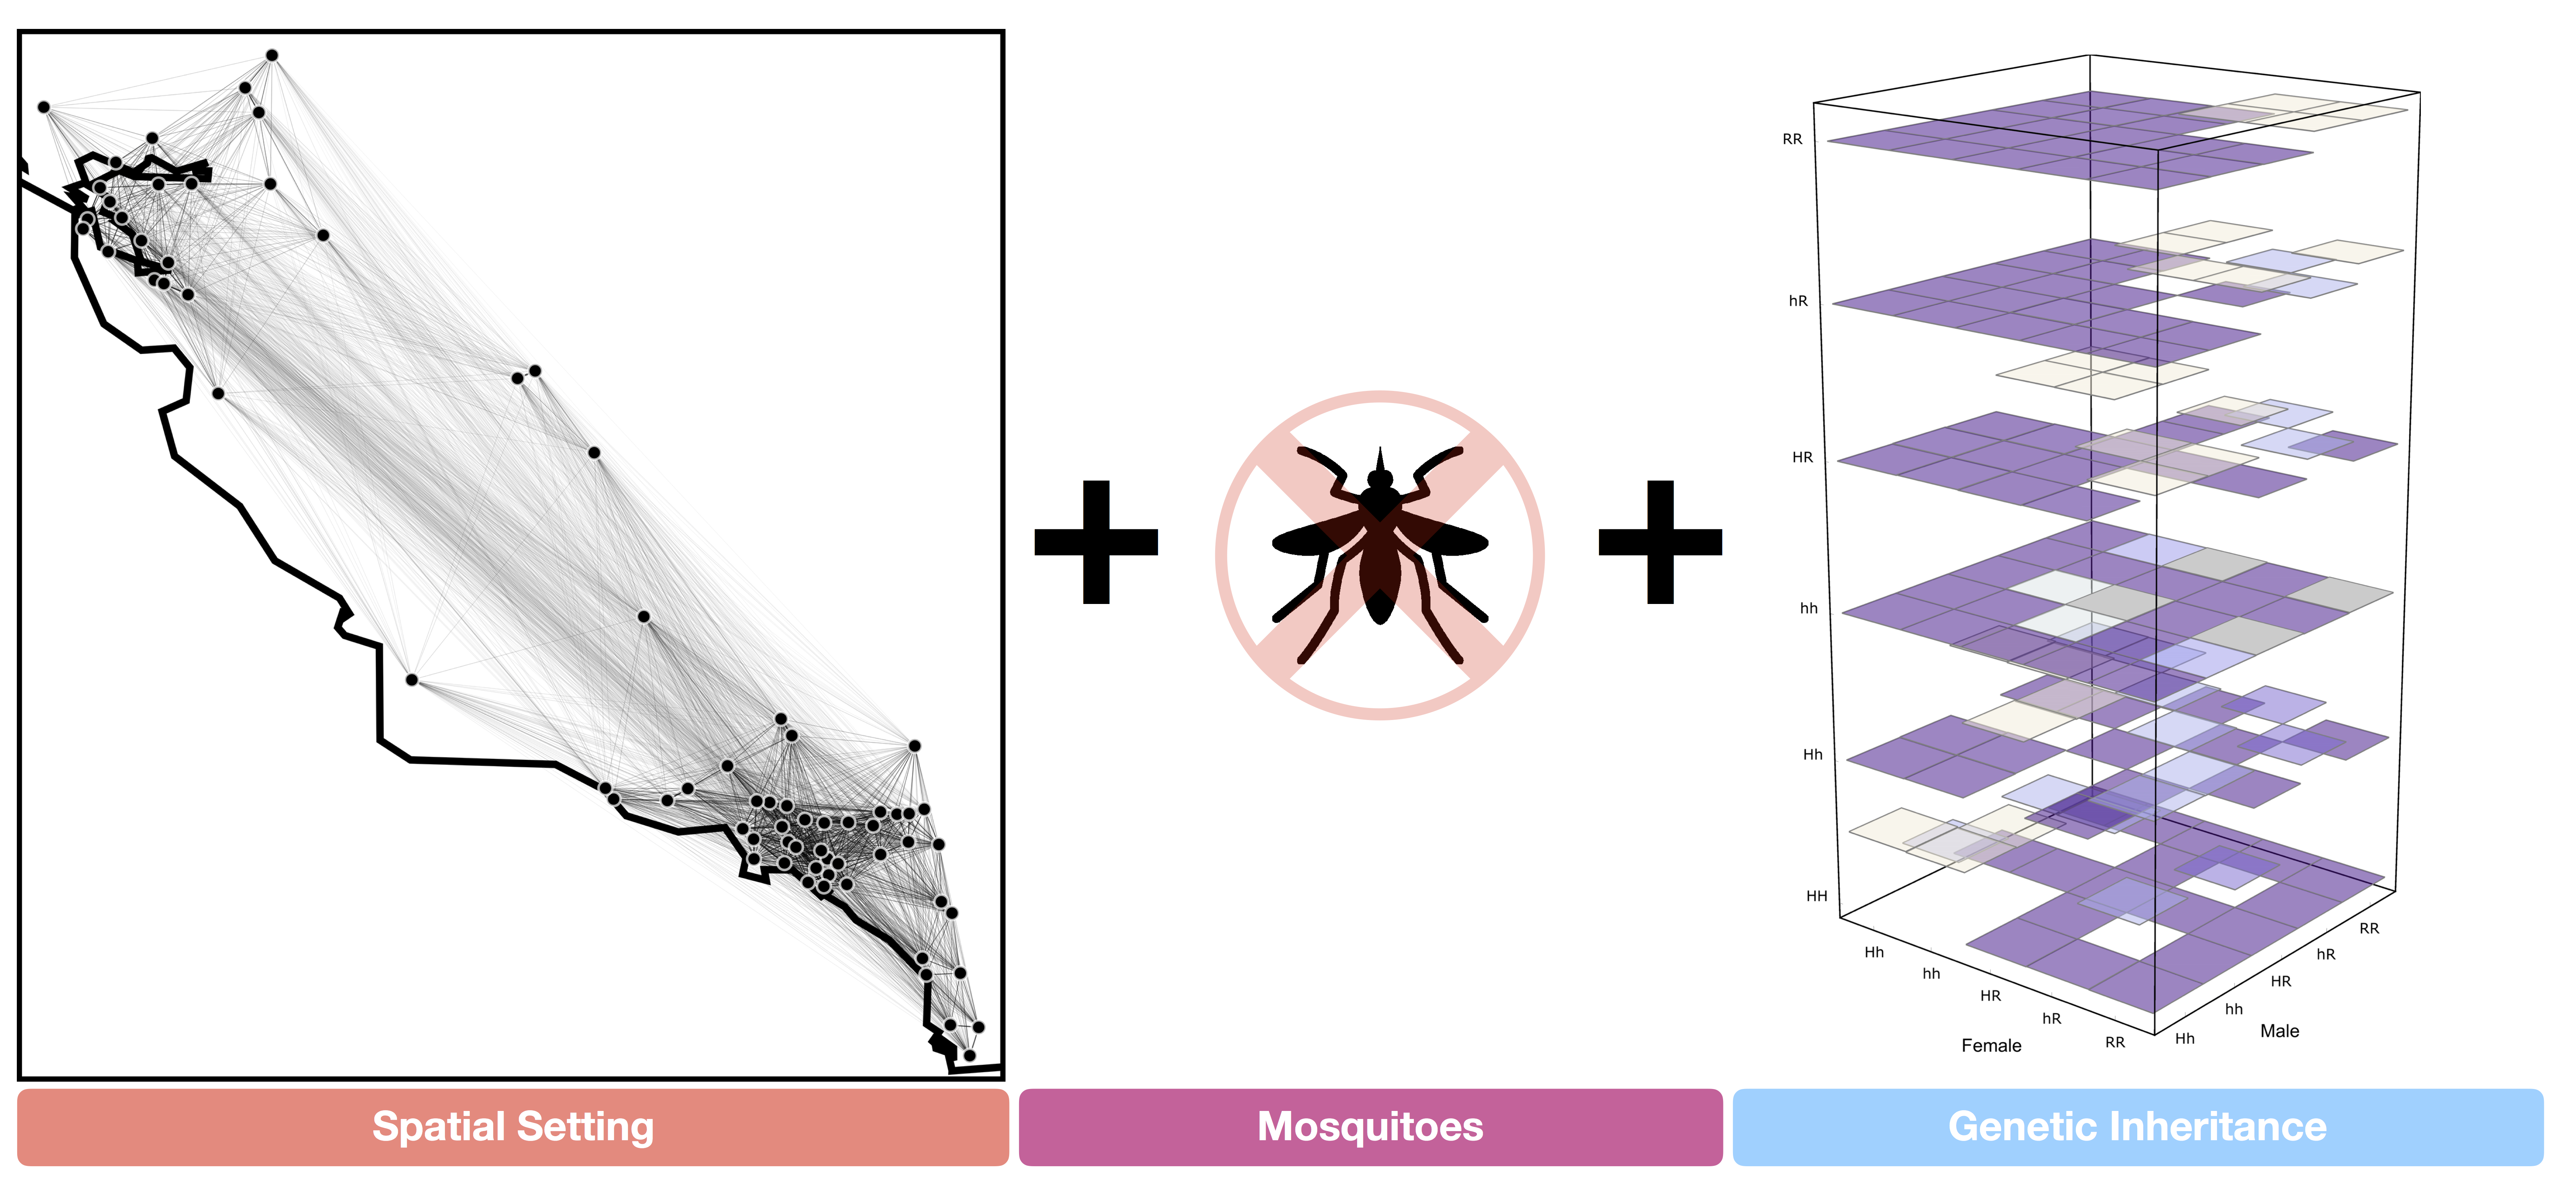
Inheritance Cube
The first element to consider, and the driver for the development, was the inheritance of genes across generations. From the equations shown above, it was somewhat apparent to me that there was an underlying “cubical” structure in the way the inheritance was being modeled (as each of the gene-inheritance entries had three indices: mother’s, father’s, and offsprings genotype), with the equation representing the probability of the offspring inheriting a particular genotype depending on inheritance parameters.
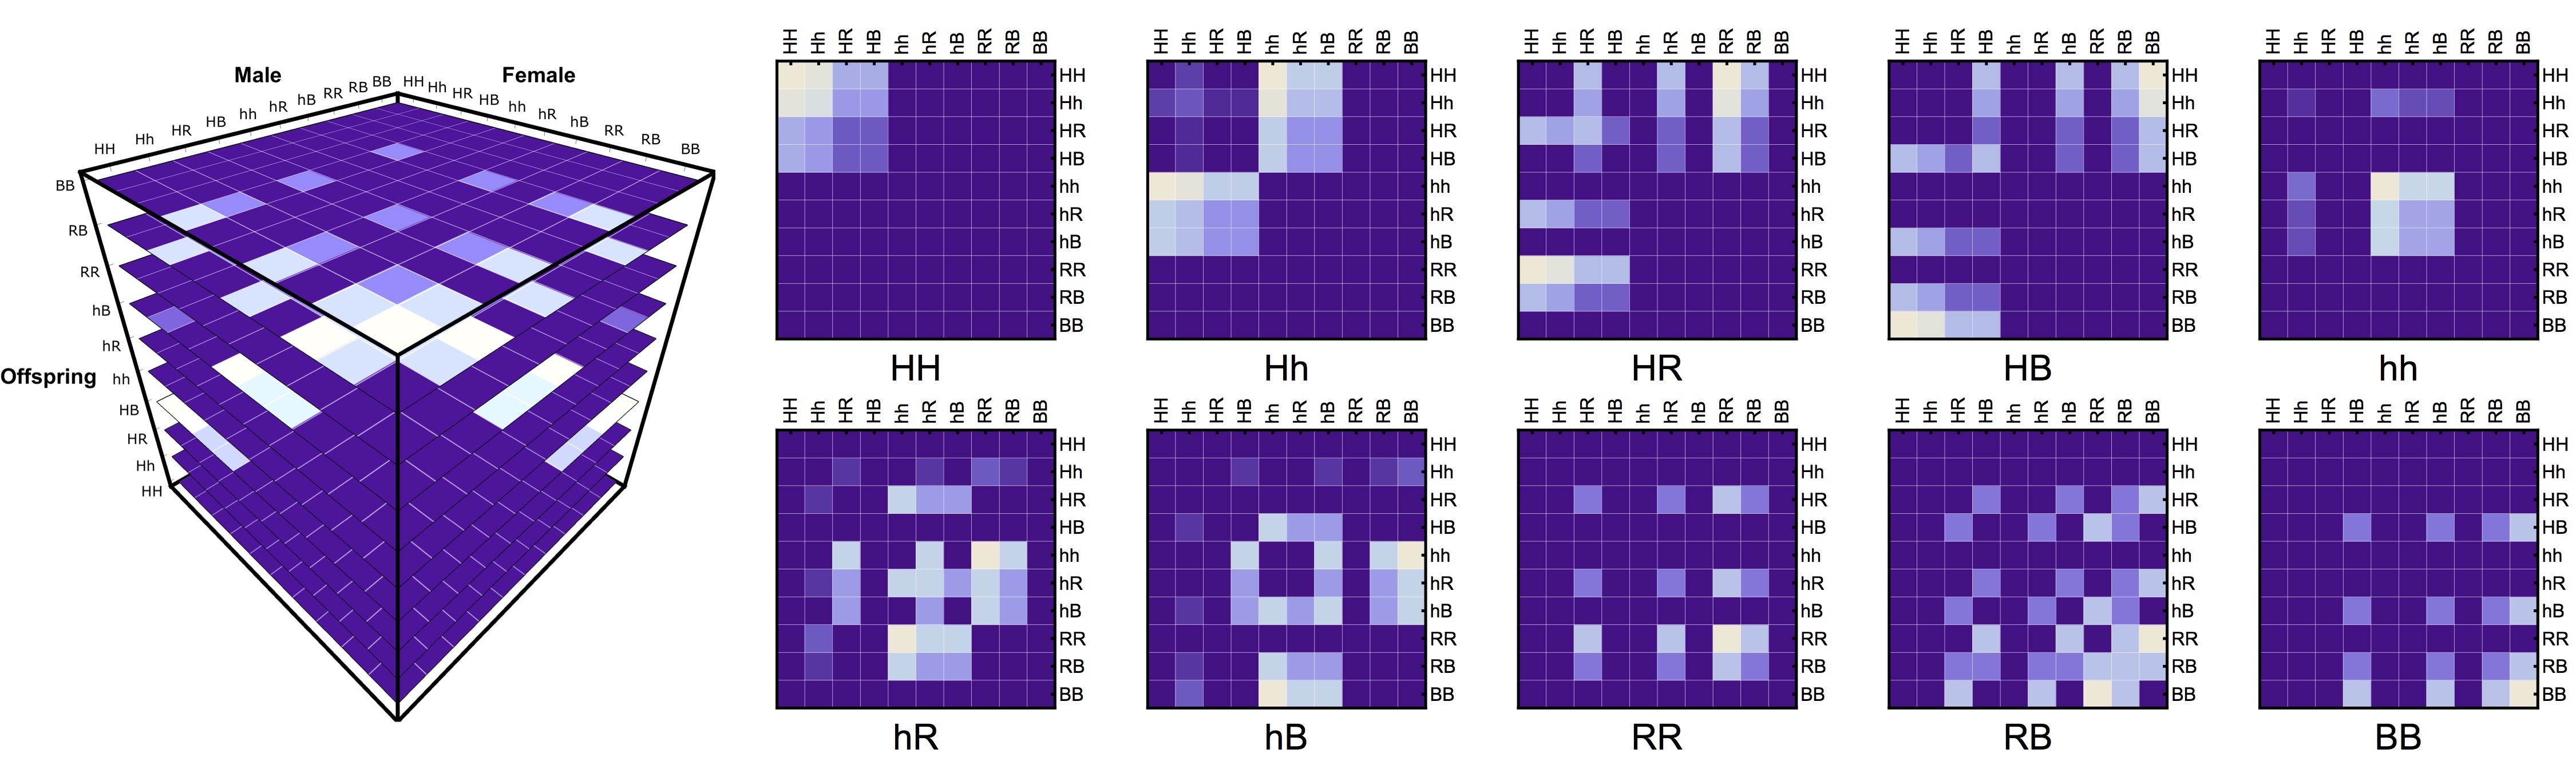
To be able to use this structure in a modular way, we created an “inheritance cube” \(\overline{\overline{\overline{Ih}}}\) structure following the aforementioned indices. This allowed us to de-couple the inheritance from the mosquito life-history module. The only other necessary step was to add gene “masks” to take into account the different effects the drive had upon the genotypes (such as fertility reduction \(\overline{s}\), cytoplasmic incompatibility, \(\overline{\Lambda}\), amongst many others).
\[\begin{align*} \overline{O(T_x)} = & \sum_{j=1}^{n} \Bigg( \bigg( (\beta*\overline{s} * \overline{ \overline{Af_{[t-T_x]}}}) * \overline{\overline{\overline{Ih}}} \bigg) * \Lambda \Bigg)^{\top}_{ij}\\ \end{align*}\]Meta-Populations
As mentioned before, it is easy to imagine the mosquito populations as a connected network in which individuals migrate at each timestep.
To do this, we take the mosquito population and select some of them for the migration (regardless of their genetic information), and move them according to a migration probability matrix \(\overline{\tau}\) which is pre-computed from a landscape analysis phase of the analysis.
\[\begin{align*} \overline{Am_{(t)}^{i}}= &\sum{\overline{A_{m}^j} \otimes \overline{\overline{\tau m_{[t-1]}}}} \\ \overline{\overline{Af_{(t)}^{i}}}= &\sum{\overline{\overline{A_{f}^j}} \otimes \overline{\overline{\tau f_{[t-1]}}}} \end{align*}\]Life History
For this module, we looked at Hancock & Godfray’s lumped age-class model. In general, the extension we made was to make every life-stage a vector in which each row entry is the number of mosquitos with a specific genotype:
\[\begin{align*} \overline{L_{[t]}}= &\overline{L_{[t-1]}} * (1-\mu_{l}) * F(\overline{L_{[t-1]})} +\overline{O(T_e)}* \theta_{e} - \overline{O(T_e+T_l)} * \theta_{e} * D(\theta_l,0)\\ \overline{E^{'}}=& \overline{O(T_e+T_l+T_p)} * \bigg(\overline{\xi_m} * (\theta_{e} * \theta_{p}) * (1-\mu_{ad}) * D(\theta_l,T_p) \bigg)\\ \overline{Am_{[t]}}=& \overline{Am_{[t-1]}} * (1-\mu_{ad})*\overline{\omega_m} + (1-\overline{\phi}) * \overline{E^{'}} + \overline{\nu m_{[t-1]}}\\ \overline{\overline{Af_{[t]}}}=& \overline{\overline{Af_{[t-1]}}} * (1-\mu_{ad}) * \overline{\omega_f} + \bigg( \overline{\phi} * \overline{E^{'}}+\overline{\nu f_{[t-1]}}\bigg)^{\top} * \bigg( \frac{\overline{\eta}*\overline{Am_{[t-1]}}}{\sum{\overline{Am_{[t-1]}}}} \bigg)\\ \end{align*}\]The only exception are the adult females, which store both their genotype and the genotype of the male they mated with.
MGDrivE’s Neat Features
As mentioned before, MGDrivE has several neat features that set it apart from competing models. A selection of these features is:
- It is open-source: anyone can look and extend the code as they see fit
- It is modular: the fact that it is divided in three modules makes it easy to work in any individual part to make it fit specific needs (which has led to some interesting extensions such as its use in rat genetic constructs)
- It was designed from the ground up for spatial phenomena: unlike other models, MGDrivE can model arbitrary landscapes in a seamless matter without needing to change any package’s code
- Gene Drives are “swappable” in place: several genetic constructs can be compared to one another in a cohesive framework by just changing a couple of lines of code
- It can be installed and used directly in R through CRAN: even though we internally use a C++ version for speed purposes, the original package was developed in R for accessibility
MGDrivE’s Youtube Playlist
Throughout the years we have developed some novel techniques to display complex spatio-temporal information (mostly through our MoNeT project); which has been really useful in communicating our results to funders and stakeholders. One strong component of these visualizations has been the generation of videos showing the results predicted by our simulations in spatial contexts, which can be found in our youtube playlist:
Availability and Publications
MGDrivE is installable as an R (CRAN indexed) package through the command install.packages("MGDrivE"); and it has been used in a long list of publications, which can be found in its main website; whilst the original paper with package description can be followed in this link.