Intro
I like doing visualizations of different types of data, so I started thinking of doing something simple with the audio information of songs. With this in mind, I started playing around with a couple of packages in python and decided on plotting waveforms in a visually appealing way.
CodeDev
Loading into pydub
First step was to load audio into Python using the pydub library in our main script:
# File: main.py
(fileName, songName) = aux.getFileAndSongNames(file)
sound = AudioSegment.from_file(file=file)
mix = aux.getMixedChannels(sound.normalize())
Audio metadata
One thing to note in getFileAndSongNames is that we are loading the song name as it is stored in the file’s metadata, not necessarily on the filename. After doing this, we mix together the two channels (L and R) of the song into the same array:
# File: aux.py
def getMixedChannels(sound):
    # Combines two channels of a loaded song into a single array
    (left, right) = (sound.split_to_mono()[0], sound.split_to_mono()[1])
    bit_depth = left.sample_width * 8
    array_type = get_array_type(bit_depth)
    (signalL, signalR) = (
            array.array(array_type, left._data),
            array.array(array_type, right._data)
        )
    mix = [signalL[i] + signalR[i] for i in range(len(signalL))]
    return mix
Color-styling
Although we could theoretically plot the wave as it is, we want it to look nice, so we define a function that creates a matplotlib colormap that changes linearly from one color, into white, and then into another color. These colors are sampled randomly from a pool defined by the user in the style file:
# File: plot.py
def defineColorMap(colorsPool):
    # Creates a duotone linear cm of two randomly selected colors defined in
    #   the pool, with a white buffer in-between
    (colorB, colorT) = sampleColorsRandomly(colorsPool)
    colorMap = [colorB, (1, 1, 1), colorT]
    cm = LinearSegmentedColormap.from_list("dummy", colorMap, N=256)
    return cm
Scatterplot
Finally, we do a scatterplot of all the values of the array that represents the waveform and we tweak style parameters to make it more visually appealing:
# File: plot.py
def plotWave(
            mix, songName, printName,
            colorMap, font,
            alpha=.075, s=.05, figSize=(30, 16.875/4)
        ):
    # Creates a stylish scatterplot of a waveform
    fig, ax = plt.subplots(figsize=figSize)
    ax.axis('off')
    plt.autoscale(tight=True)
    plt.scatter(
        range(len(mix)), mix,
        c=mix, alpha=alpha, cmap=colorMap, s=s
    )
    if printName:
        plt.text(
            .5, .5-.01, songName, fontdict=font,
            horizontalalignment='center', verticalalignment='center',
            transform=ax.transAxes
        )
    return (fig, ax)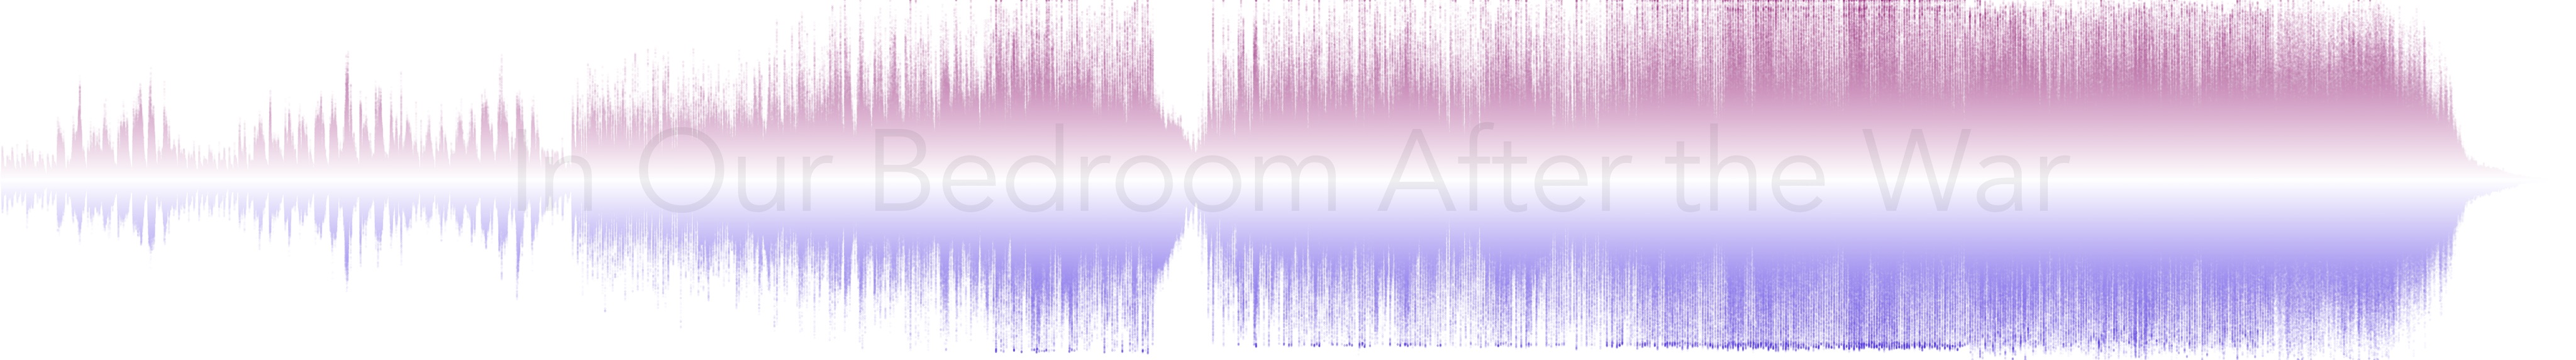
With these steps in place, we put it all together in a script that runs through audio files stored in a folder in batch mode with options to change the fonts and styles!
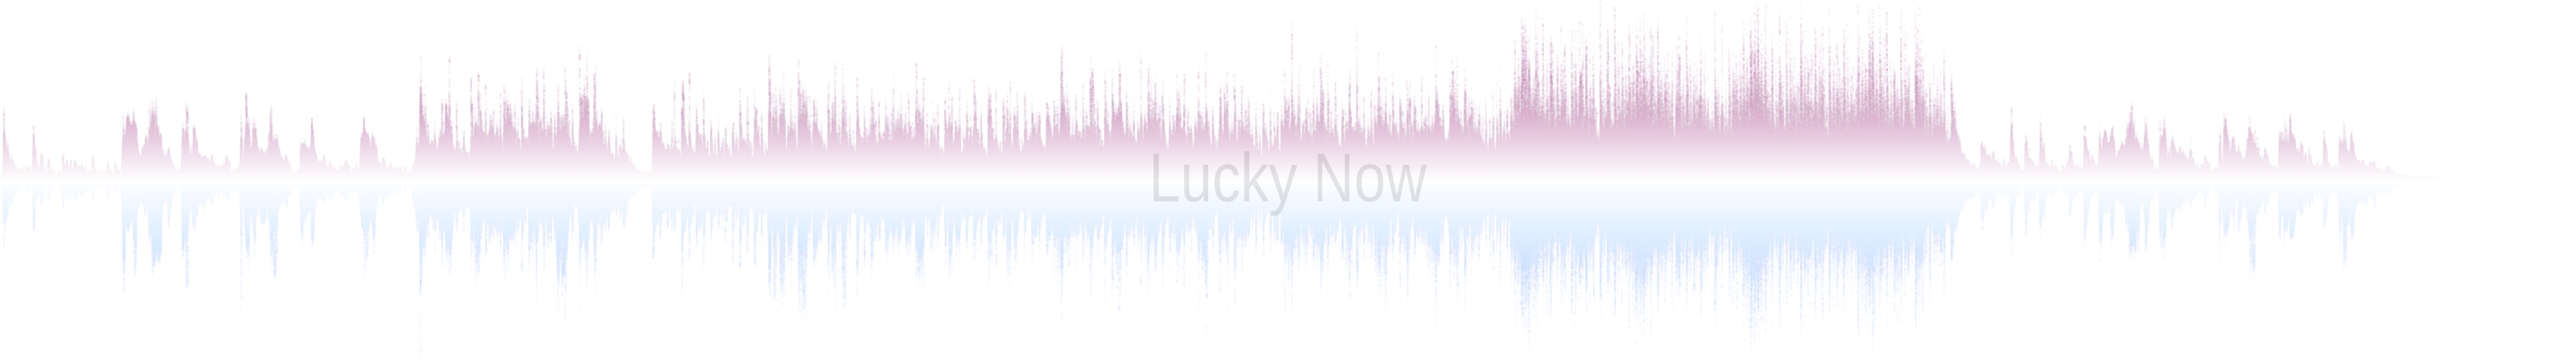
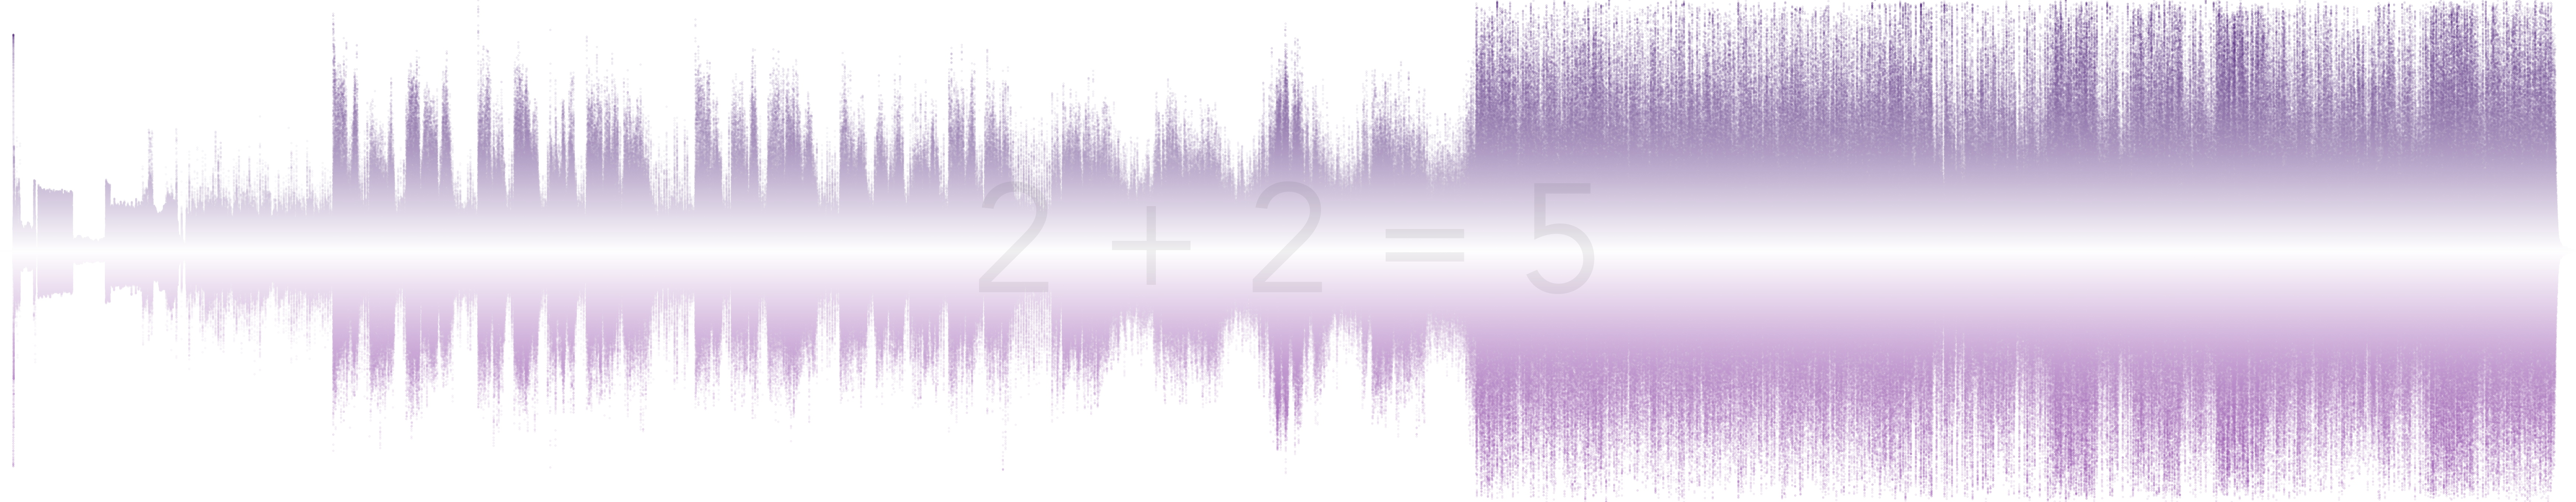
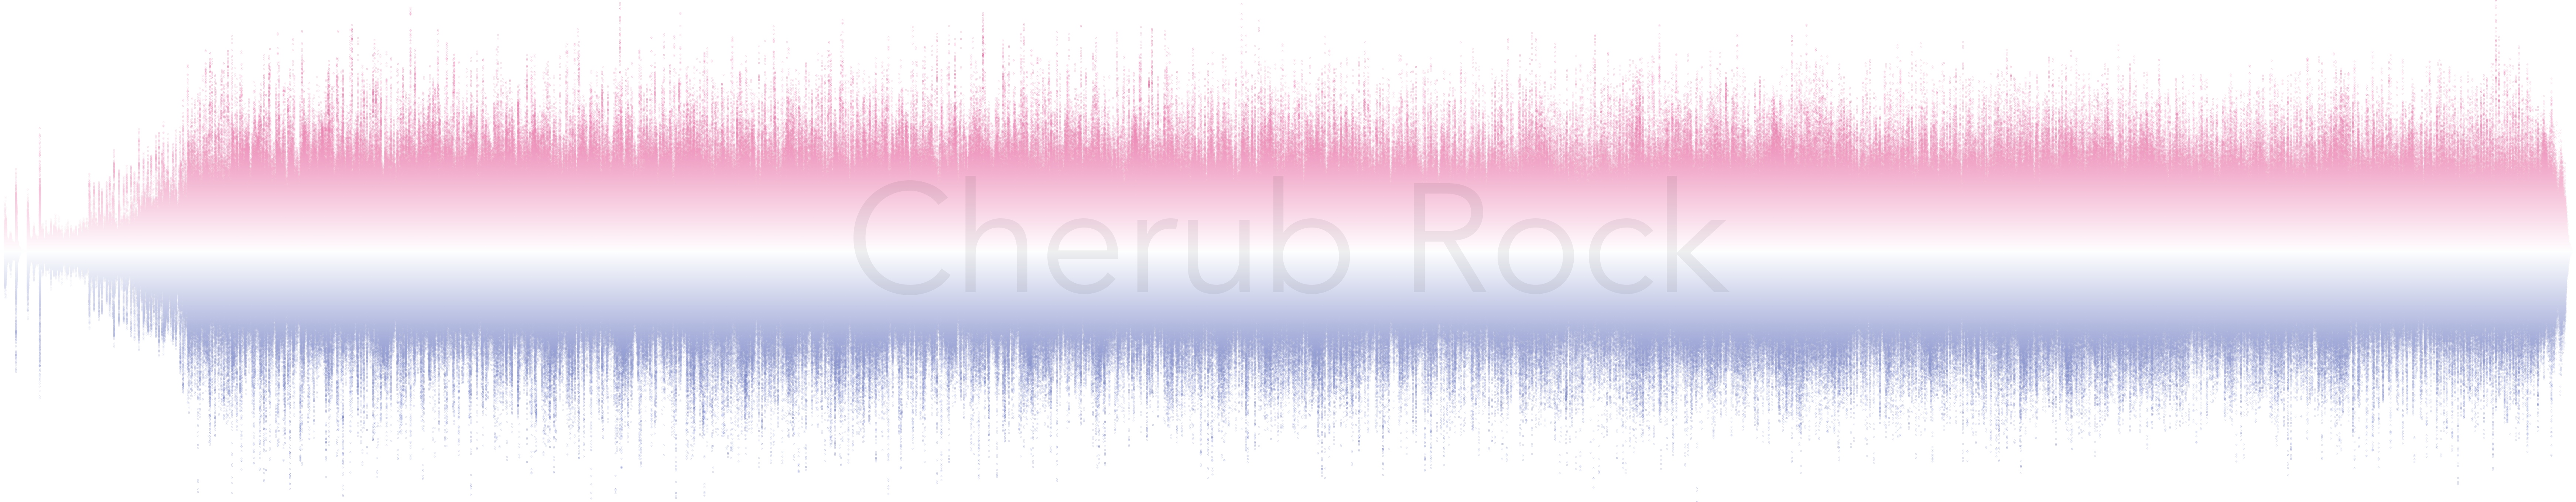
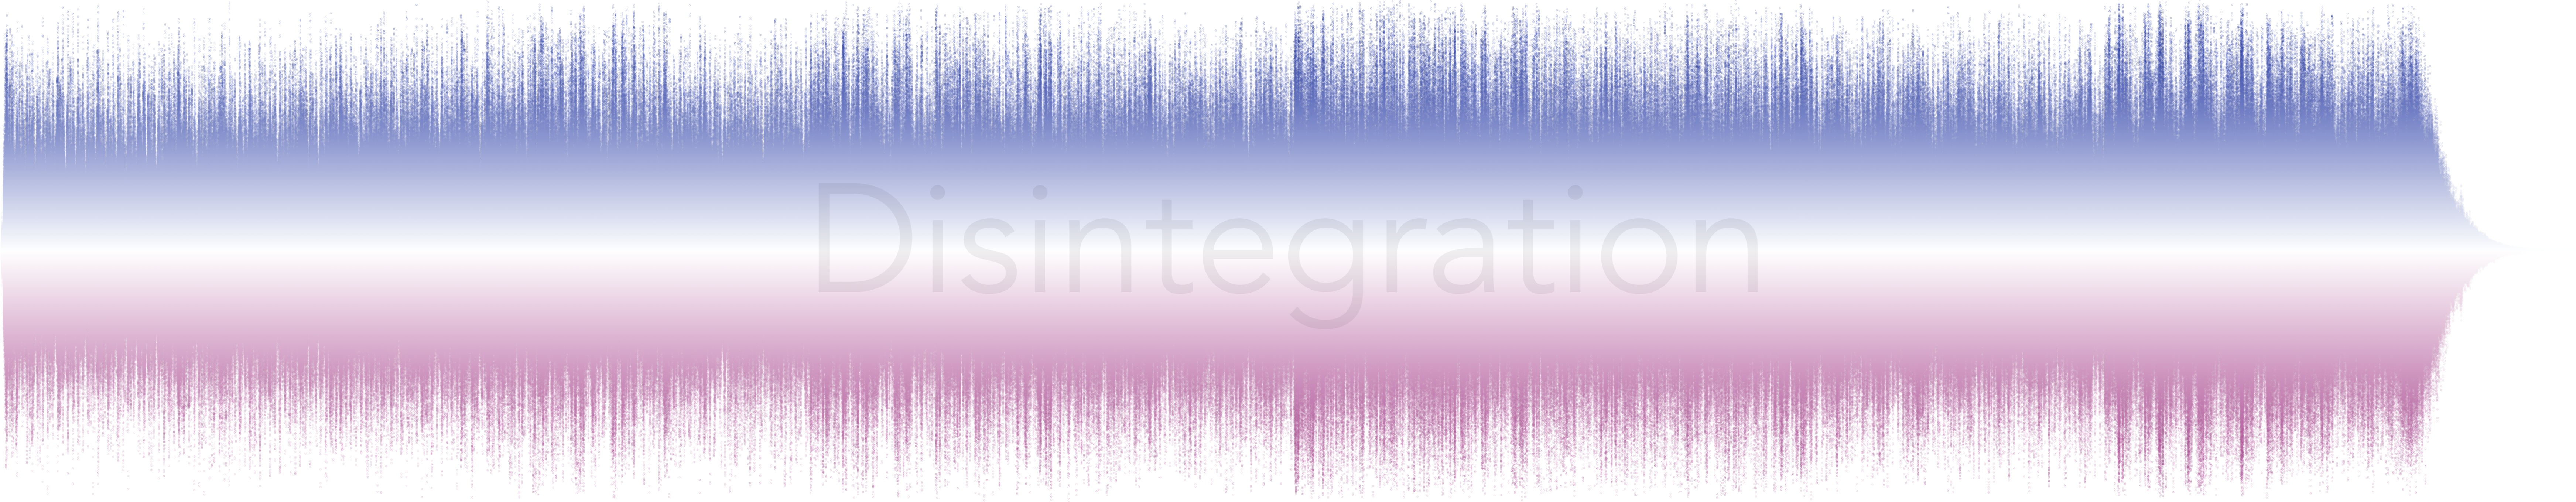
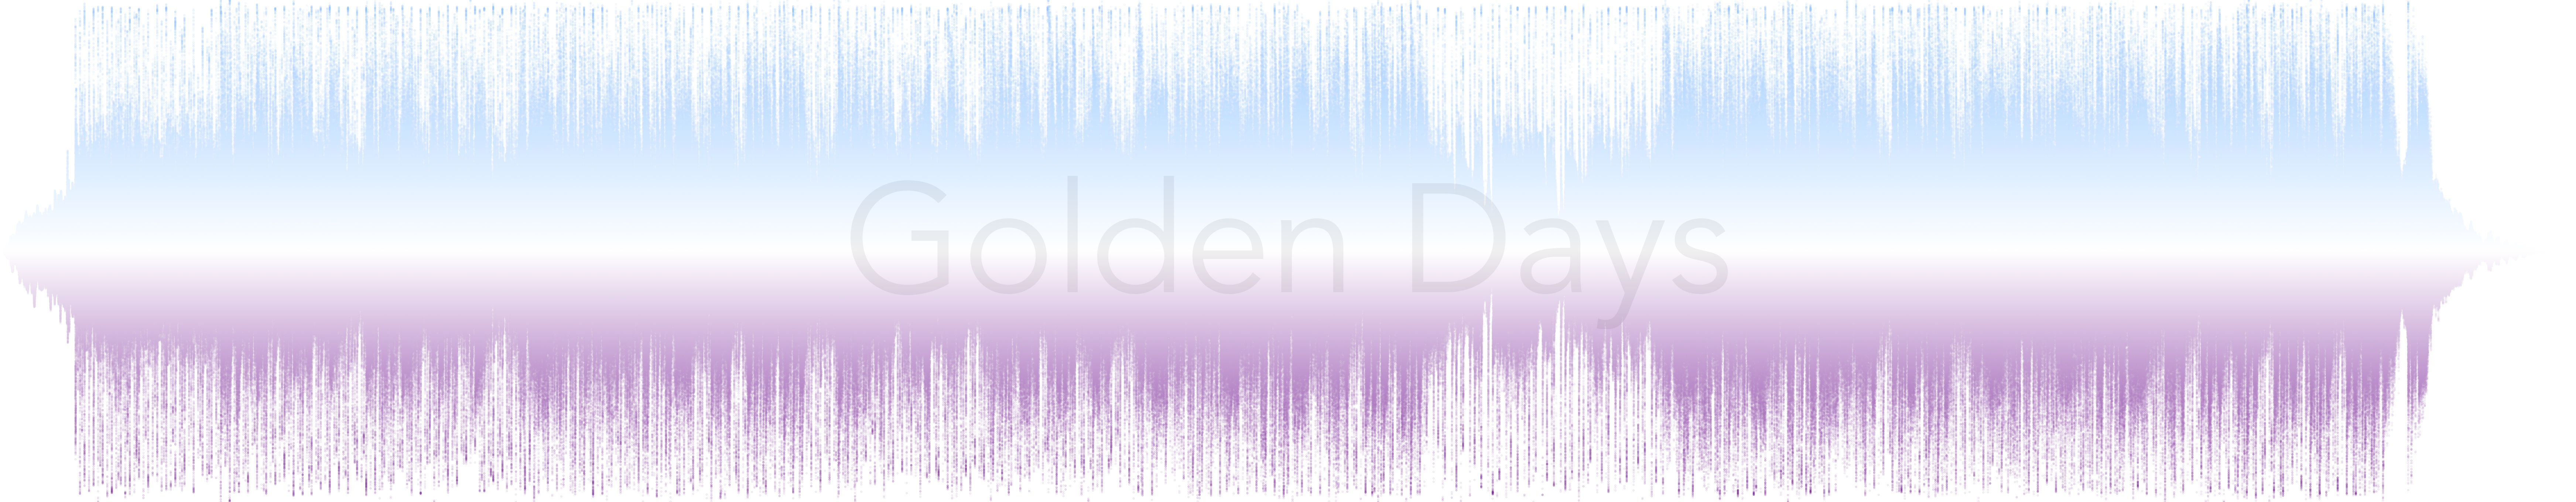
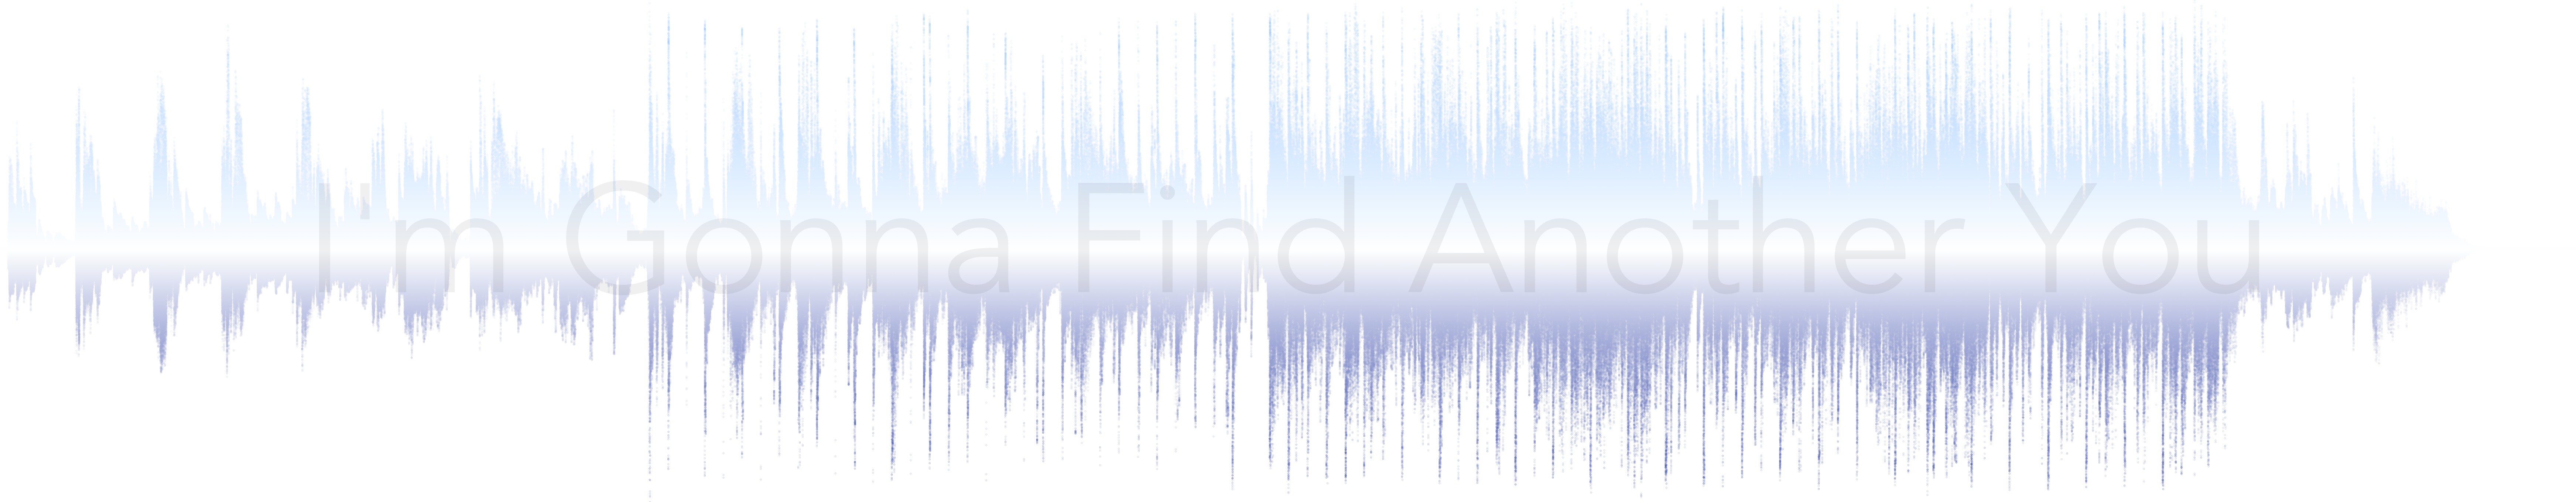
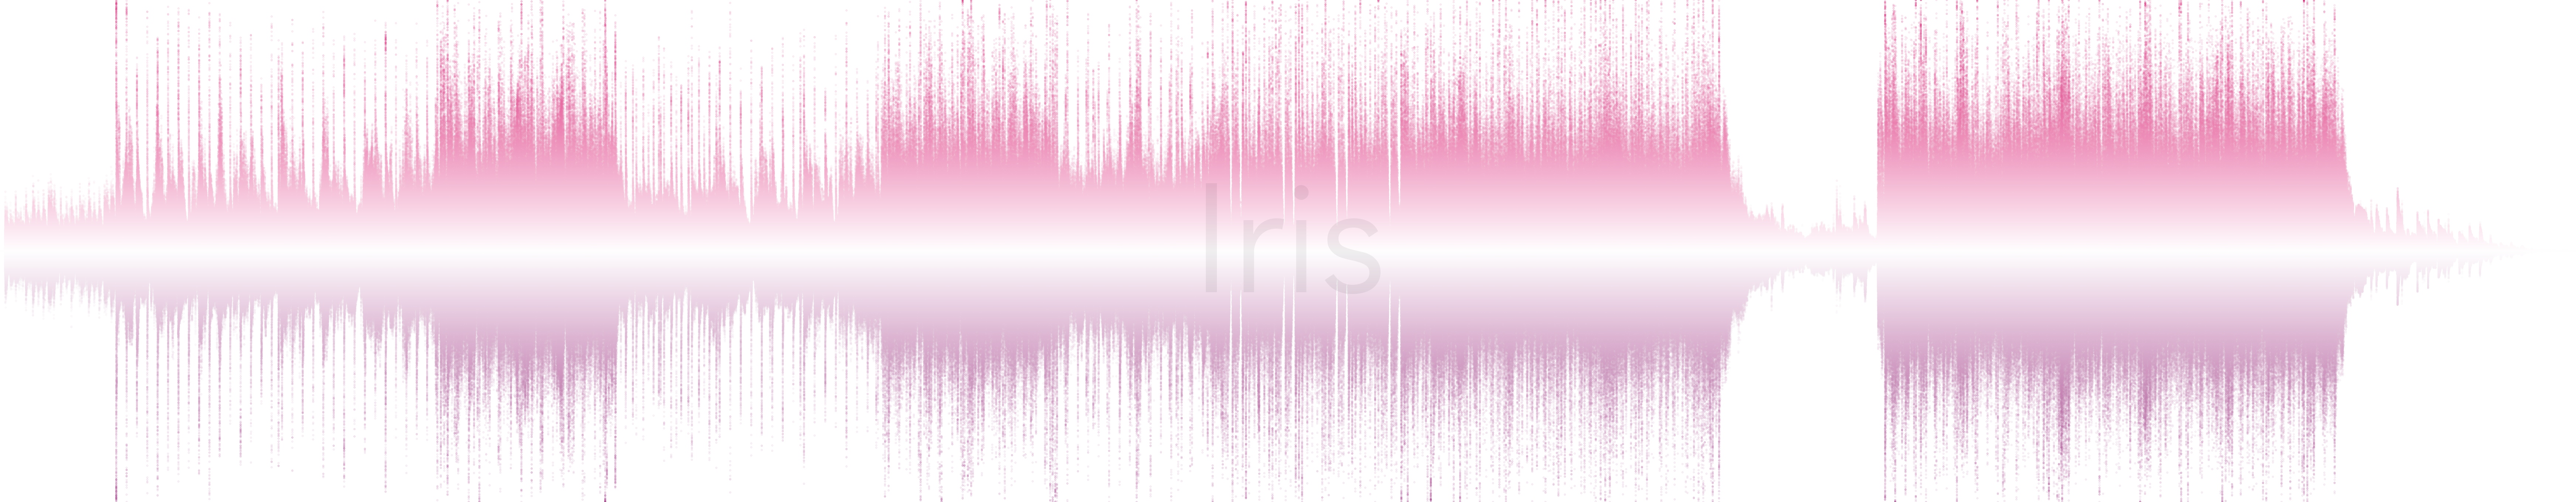
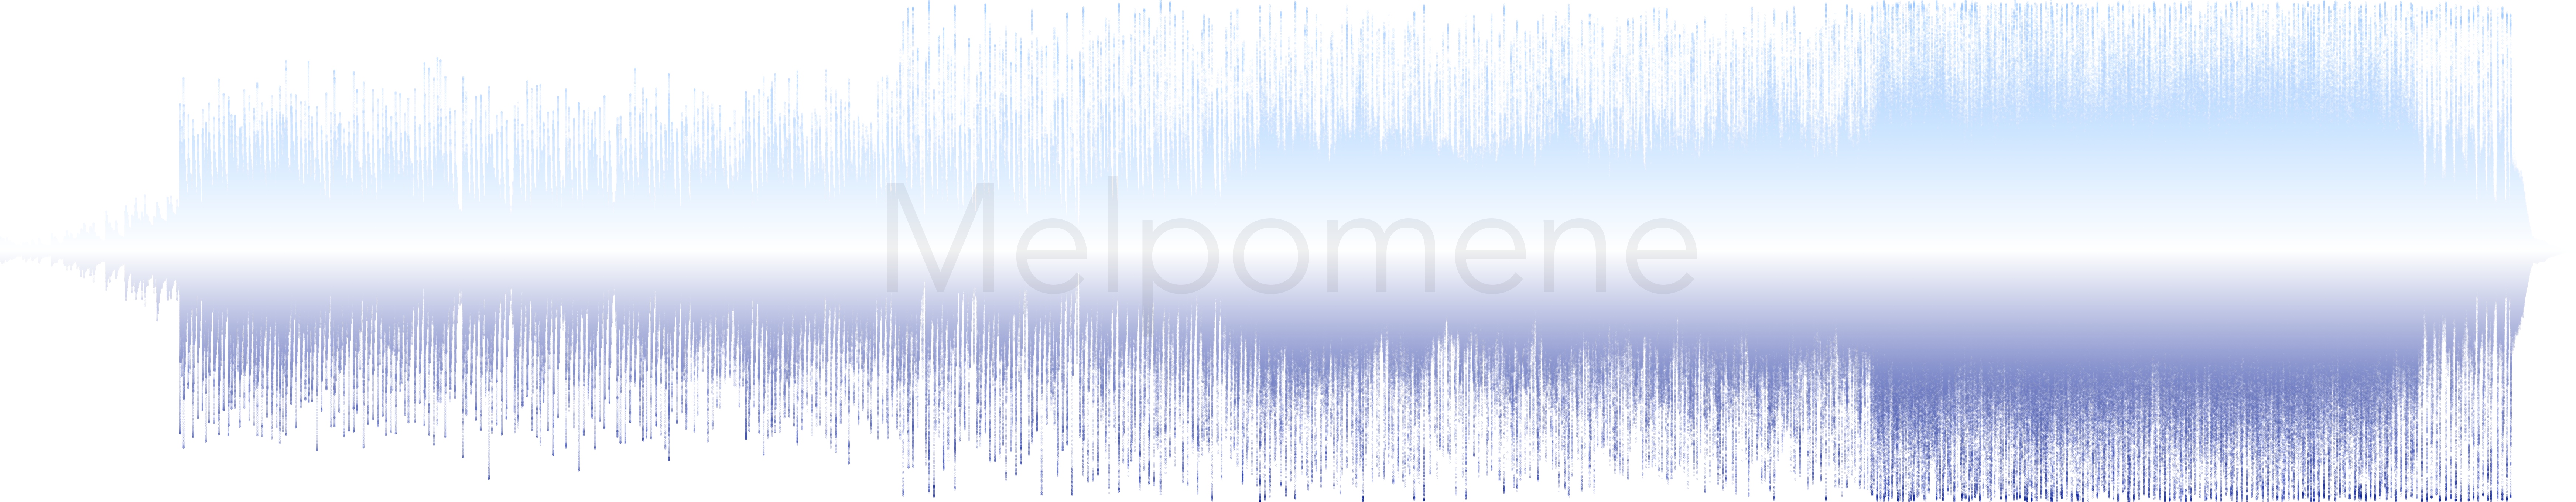
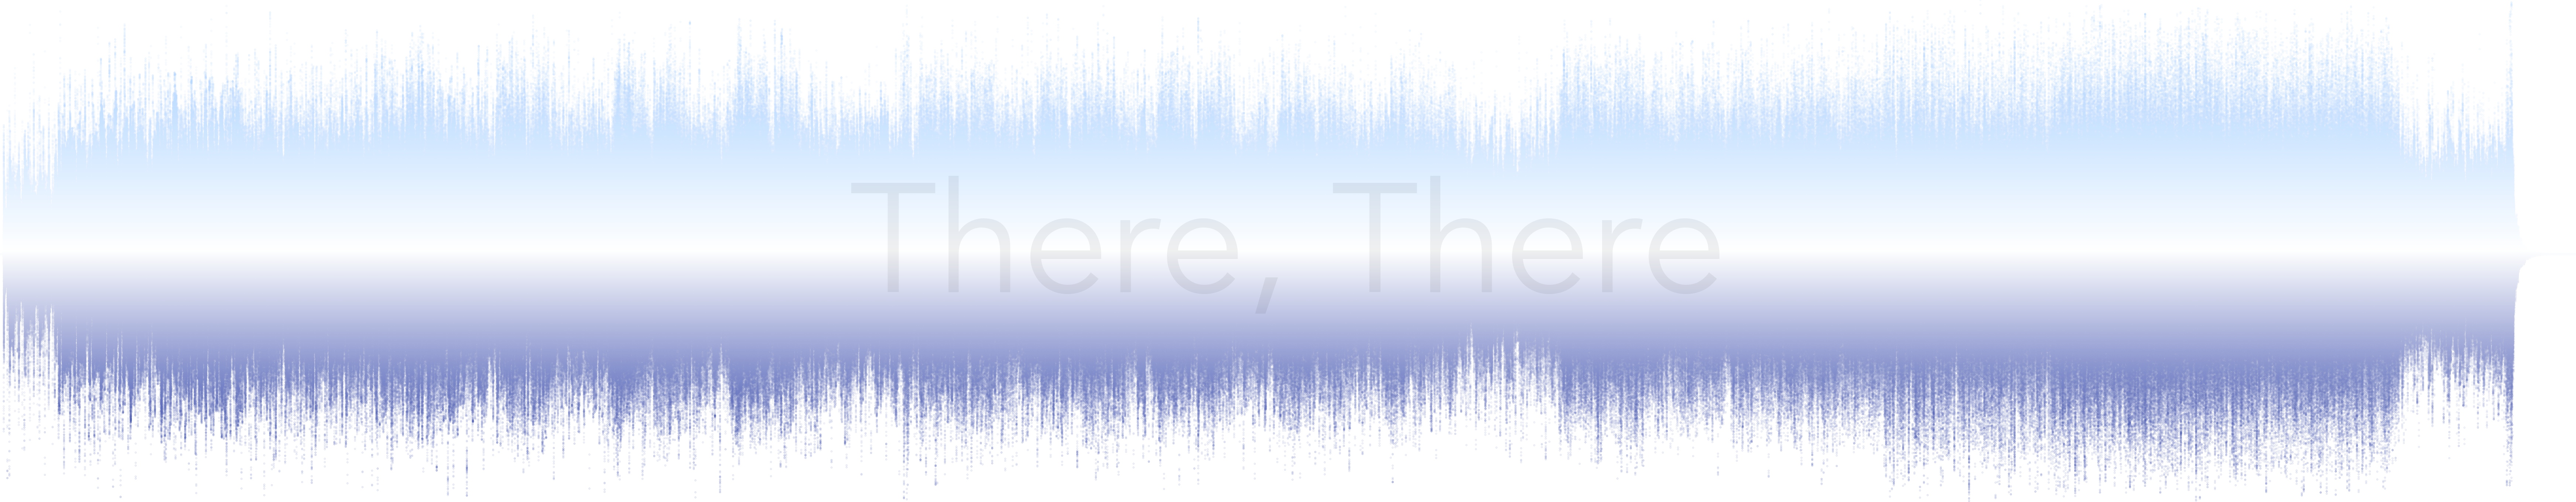
Gallery
Code repo
- Repository: Github repo
- Dependencies: pydub, matplotlib