Sink/Source/Bridge Dynamics in São Tomé and Príncipe
Mosquito movement patterns offer valuable information for analyzing the transmission of mosquito-borne diseases as mentioned here. One way to examine movement patterns in a complex network involves identifying the sinks, sources, and bridges in the network. We call a collection of nodes a sink if the total flow into each node is greater than the total flow out, a source if the total flow out of each node is greater than the total flow in, and a bridge if the inward and outward flows are roughly the same. The process of categorizing the communities in a landscape into these 3 general categories is known as sink/source/bridge detection (SSBD). By performing this technique, it is possible to obtain a broader picture of how mosquitoes traverse the landscape, which regions in the network are most popular for mosquitoes, and much more. To put these ideas into context, we examine a small network located in São Tomé and Príncipe.
To perform SSBD on a network, we need a stochastic matrix that encodes mosquito movements between locations as probabilities. We will refer to this as a kernel and denote it by . We also need a list of locations and the initial population of mosquitoes at each location. Each location is presumed to represent a fundamental resource for mosquitoes, and we use
to denote the populations of each location. We use a simple model of the form
for
. Finally, we will need a clustering algorithm. For demonstration purposes, we will use K-means.
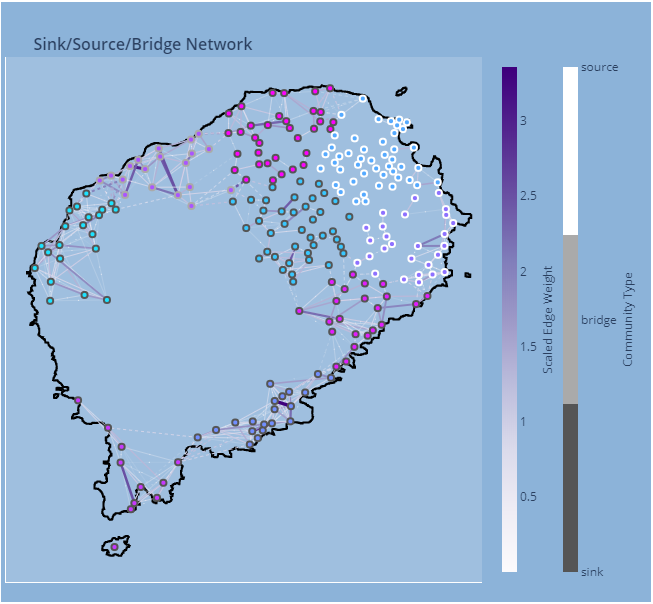
At a high level, SSBD consists of three stages: clustering, computing proportions, and classifying. Once this is performed, one simple yet important question we can answer is: how many sinks, sources, and bridges are there at steady state? The image below depicts a steady-state mosquito network in São Tomé using 10 clusters for K-means. Nodes with the same inner color are in the same community, and the borders of each node indicate the type of community it is in. The edges correspond to transition probabilities. If we look closely, we can see that there are 6 sinks, 2 sources, and 1 bridge. The last community is in Príncipe, which we will show shortly. In this network we see that sinks tend to appear more towards the South-East part of the island while sources tend to appear more towards the North-East part of the island. This may suggest that mosquitoes tend to favor the former region over the latter, which helps in tracking the spread of mosquito-borne diseases.
We can make similar observations for the network in Príncipe, which is shown below.
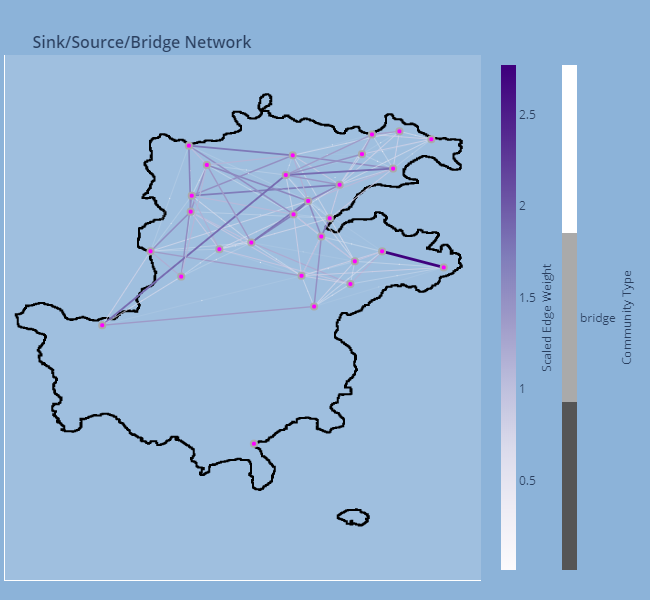
Here, we can see that Príncipe contains one bridge community that is completely isolated from São Tomé. The edge colors indicate that most movement generally occurs in the center region of the island as opposed to the borders. This information is useful for modeling how a certain disease will spread throughout the landscape.
Hopefully, this brief introduction to SSBD has introduced the types of analysis that can be performed with the technique. There are many more pressing questions we can begin to answer with SSBD, but we will leave it at here for now. Here’s a link to the package used for SSBD.
Authors
Chris De León, Tomás León, Héctor M. Sánchez C.